Model Evaluation
November 23, 2020
Model Recap
To give a brief summary of my model, I used a polls-only binomial logit regression to find the probability of a single voter voting either for Biden or Trump, and then using that to run 10,000 election simulations across the likely voter population (LVP). (After correcting a minor error in my code) I predicted Biden would win 350 electoral votes to Trump’s 188, winning the following states:
Average Simulated Election: State Results
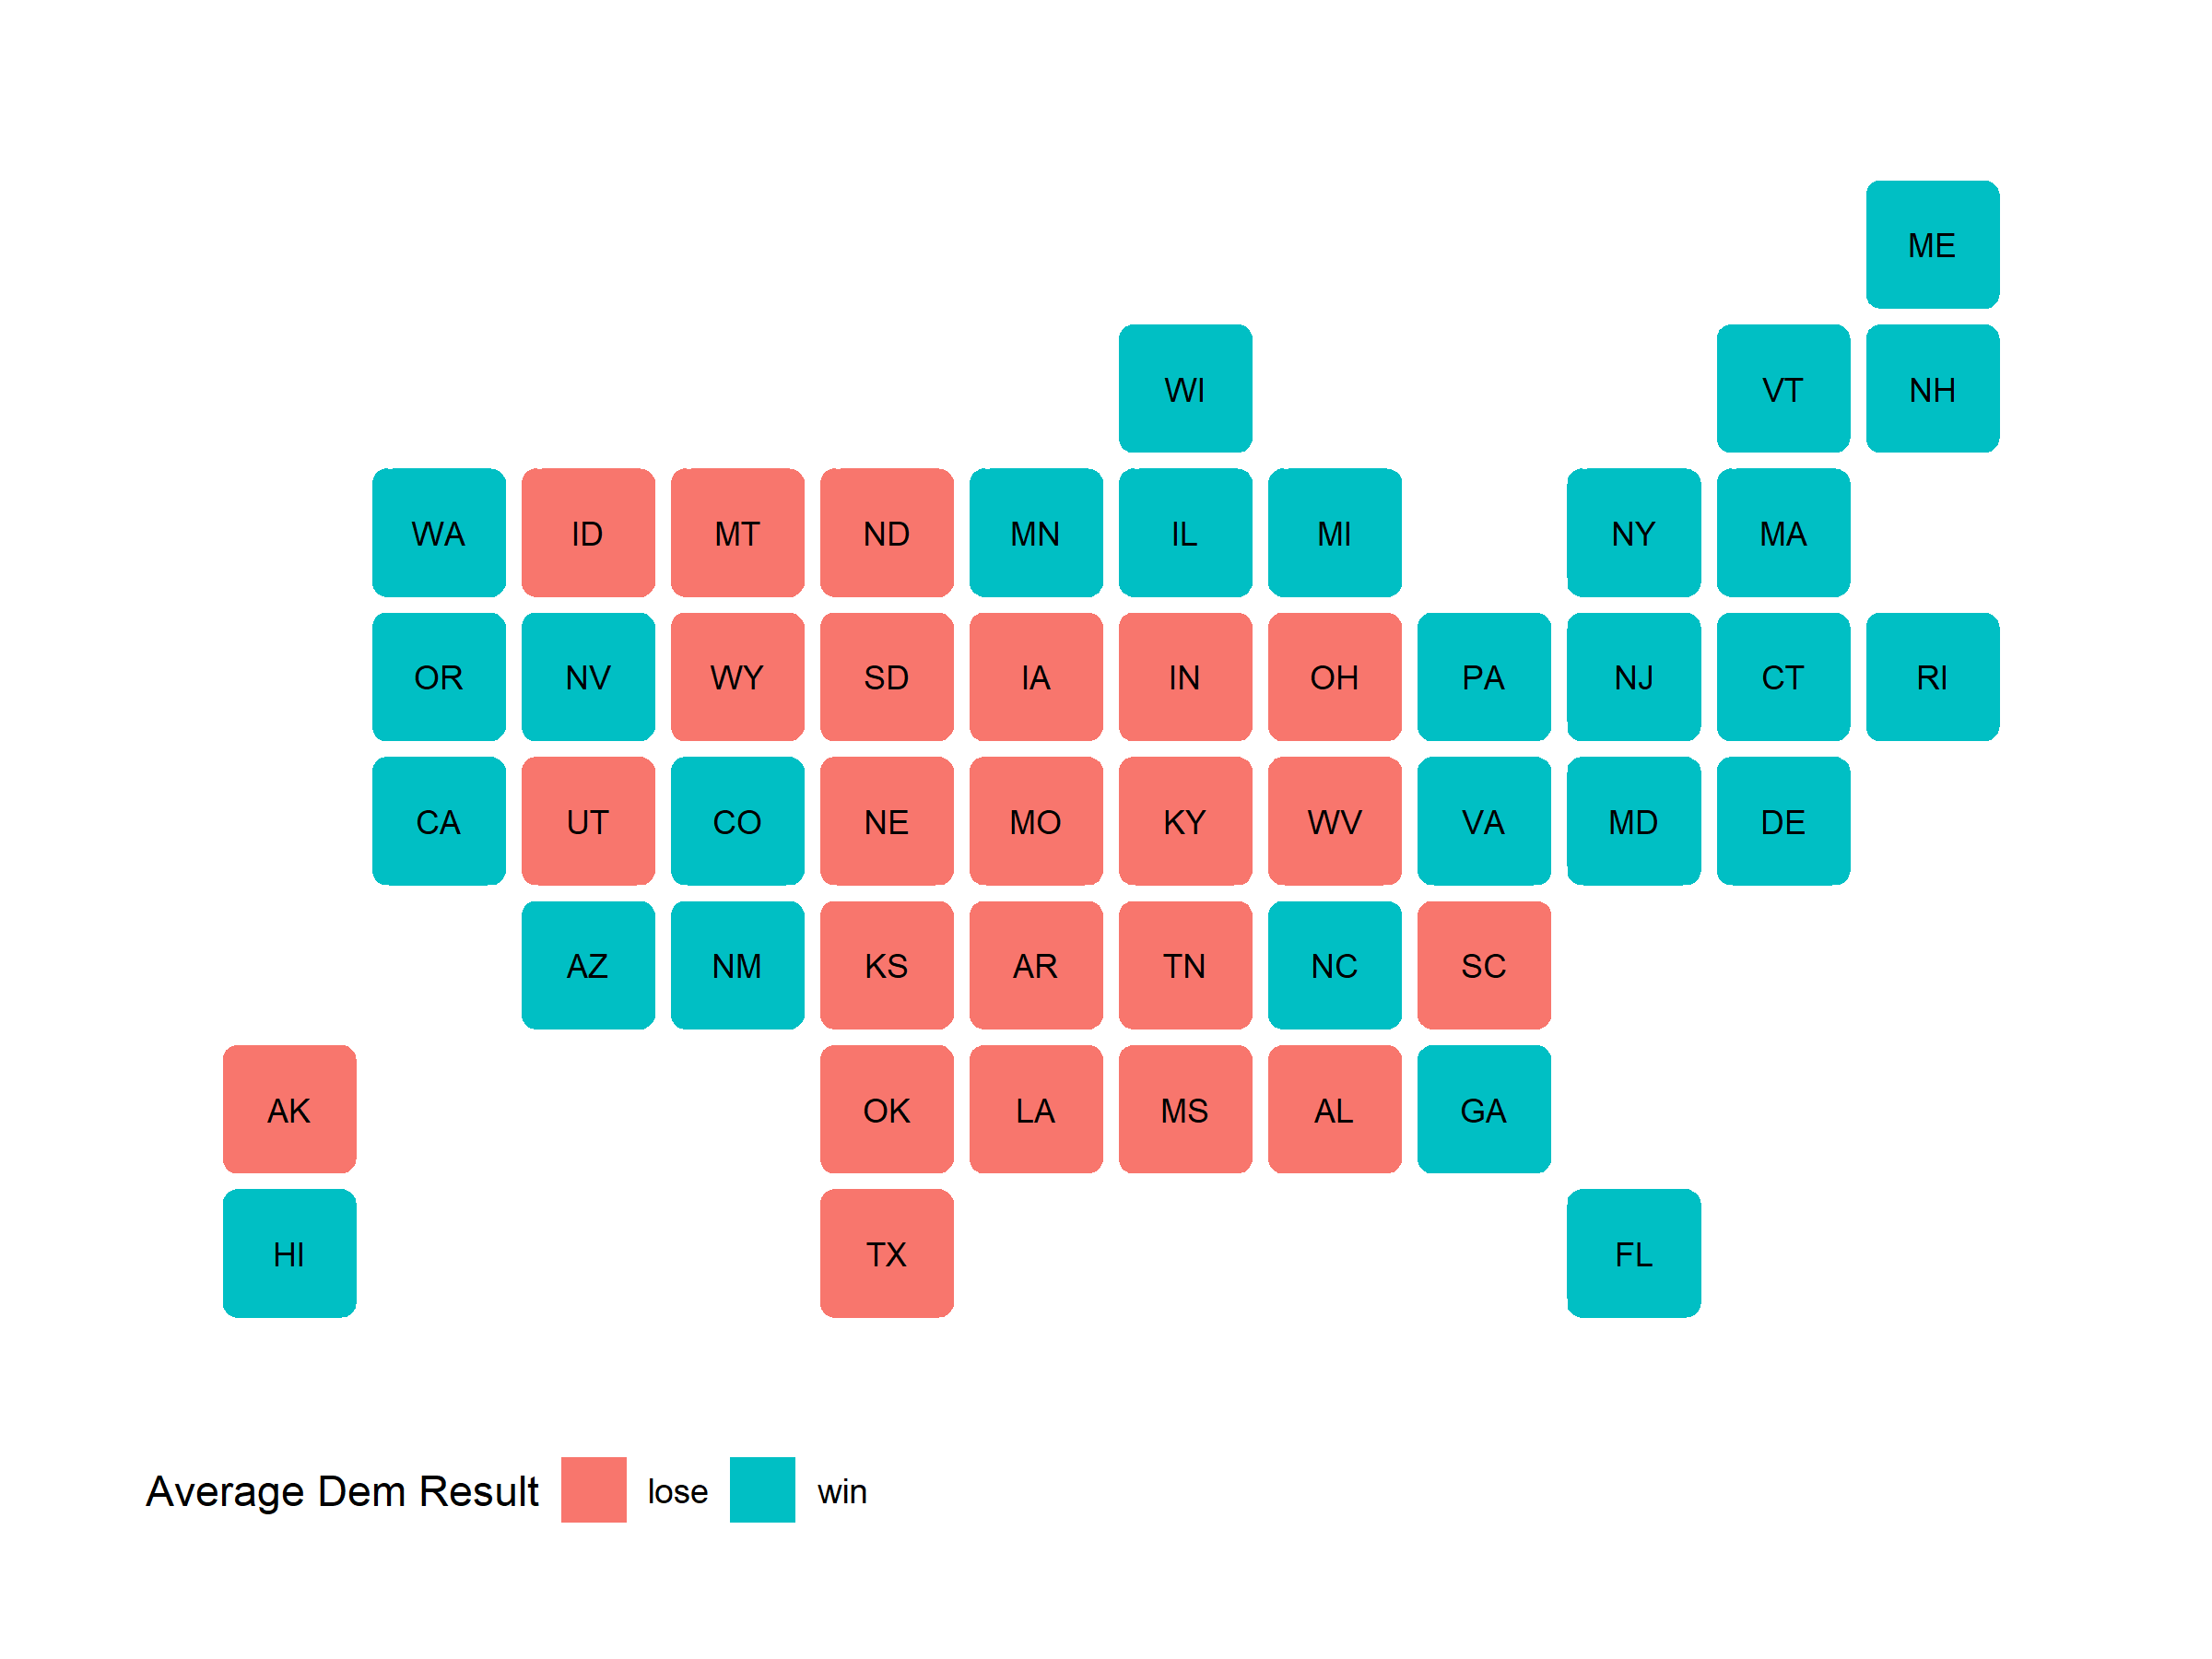
This map correctly predicts the winner of 48 states, missing only Florida and North Carolina. Although this is a fairly accurate performance of predicting a binary variable, it accounts for neither the closeness of each state election nor the confidence in that outcome.
Accuracy
To examine this aspect of accuracy, I created a classic scatterplot of actual Democratic state two-party vote share against predicted state Democratic two-party vote share. Here are the results:
Democratic Two-Party Vote Share by State: Actual Vs. Predicted
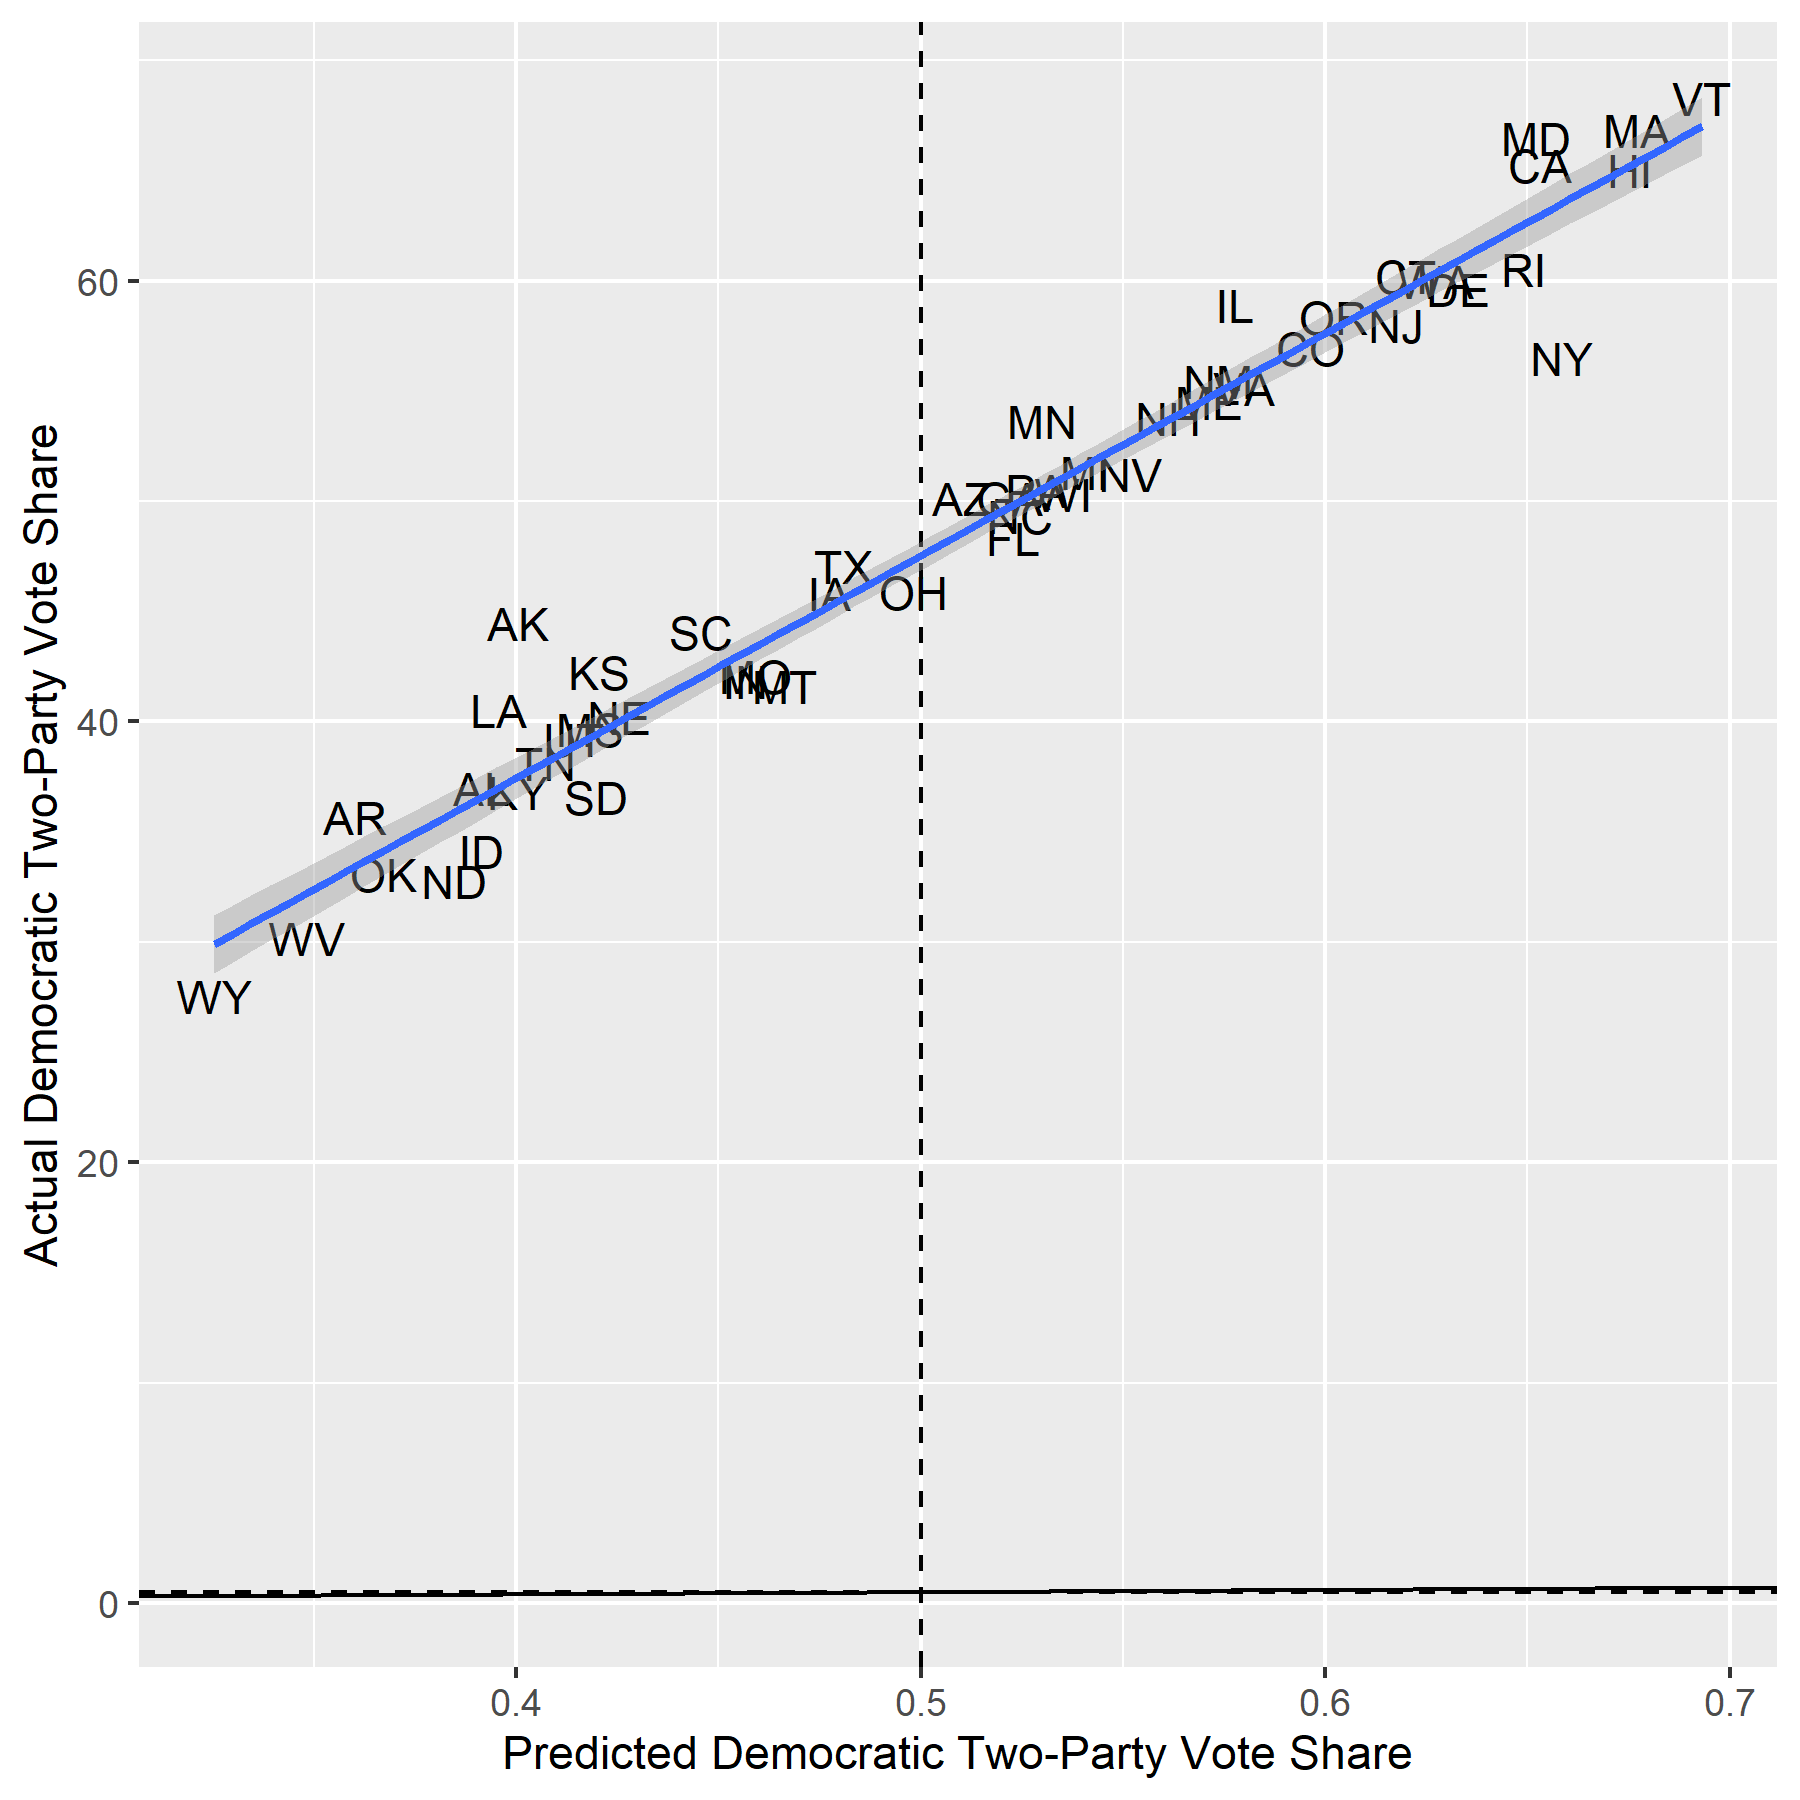
The regression slope is parallel to perfection. I was amazed and devastated at once when I first saw this graph. On the one hand, my model uniformly overestimated Biden’s two-party vote share, which is regrettable for accurately predicting vote shares in battleground states–my RMSE is 3.29, which is in the same ballpark as the RMSEs of FiveThirtyEight (3.04) and The Economist (2.83). On the other hand, the trend line is nearly exactly parallel to the 45-degree line, which is the measure of perfect accuracy. If I could somehow correct for this rightward shift, my predictions would enjoy a marked improvement.
Another measurement of accuracy I employed is the Brier scoring function. Rather than measure two-party vote share accuracy, it instead measures confidence accuracy, taking the mean squared error between my forecasted state win probabilities and the binary value of the actual state result (1 if Biden won, 0 if Biden lost). For example, my model predicted Biden had a 97.7% chance of winning Vermont, which he did win; my Brier score for Vermont would then be 0.000529. Overall, my model’s Brier score is 0.076, which is better than random chance (0.25), but a far cry from our class average (0.029).
Hypotheses for Inaccuracies
I have a two main hypotheses for why polling data, the only input my model took, similarly overestimated Biden’s advantage going into the election.
The first hypothesis pertains to partisan or differential non-response bias: pollsters are fundamentally ill-equipped to handle non-response bias. It may be that the type of voter who does not pick up the phone or reply to email to respond to polls and surveys is more likely to vote for Trump, whether by being conservative (a prevailing theory is that Democrats during the pandemic were easier to reach for surveys and generally more willing to engage in surveys) or having traits correlated with the Republican party coalition (rural, non-college educated). Maybe they were simply unavailable, or maybe they lack trust in polling institutions enough to actively avoid participating, as is sometimes asserted.
The second hypothesis pertains to methods of poll aggregation and possible liberal bias amongst pollsters. The inherent risks of survey methods outlined in the first hypothesis can be compounded through the practice of pollster grading. FiveThirtyEight weights their polling models based on a holistic grade given to each polling institution based on various factors. Based on these pollster grades, some polls may be excluded from their models. If memory serves, I remember Professor Enos mentioning that RealClearPolitics included surveys other poll aggregators were reluctant to touch–SurveyMonkey (538 Grade: D-), to name a prominent example–that gave a more accurate picture of Trump’s support going into the election.
Maybe there is widespread liberal bias inside polling organizations leading to Democratic-leaning “house effects,” though I think it is improbable. More likely, this could indicate a worsening trend of “herding,” whereby many lower-quality polling organizations “herd” around the estimates of a few reputable polling organizations, hoping to piggyback off their efforts and give the illusion of accuracy. This phenomenon is detrimental to polling averages and could be behind the over-exaggeration of Biden’s lead.
A third, more fringe hypothesis revolves around a “Trump distortion effect.” This hypothesis posits that Trump is such a galvanizing figure that it affected all aspects of the political system: cable news, social media, pollsters, party messaging, general governance, forecasters, and individual voters. He is like a magnet upon a compass–we cannot blame what has guided us so well for so long when it is under an influence so baneful to its existence. Trump is thus an outlier, not fit for and indeed disrupting mainstream, finely tuned election models. Under this hypothesis, our current models may not need to change with Trump’s exit from the political stage.
Possible Tests for Hypotheses
For the first hypothesis, it is difficult to consider tests to find people who do not respond to tests. In an ideal world, we would have methods in place to ensure equal probabilities of contacting any (likely) voter in the country. However, in reality the only choice seems to be to restore conservative trust in news media and polling organizations to increase response rates and assess whether those results would have been substantively different than just weighting.
For the second hypothesis, I could create three separate models–one based on pollsters rated B or higher, one based on pollsters rated B- or lower, and one combined model–and compare their predictions. Alternatively, I could measure the spread of polls over time to find evidence for herding in general, giving particular attention to battleground / swing states, and assume from there the downsides for poll aggregation.
For the third hypothesis, the only test is time. We always want the answers in the moment, but our politics need time to settle and remove itself from a Trump- dominated, reality warping landscape. If current polling methods are used in the 2024, 2028, 2032 elections and return to accuracy, we will have found our answer.
If I Had to Do It All Over Again
There is only one thing I would add to my model: Q3 GDP growth. It is common practice to use Q2 GDP growth based on historical predictive power and easy availability, but looking back it may have been prudent to represent a recovering economy using data that was available days before our final prediction was due (Yao Yu actually posted a Q3 GDP dataset from the BEA on October 29th on the Slack channel). Including this data would have been a nice compromise between using conventional economic indicators and utterly abandoning them, and would have hedged my probabilities for close states like Florida and North Carolina.
It’s Been Fun
It has been a pleasure to work with such intelligent and involved classmates in analyzing, predicting, and dissecting this election. I give my thanks to Soubhik Barari and Professor Ryan Enos for teaching me so much about elections, modeling, statistics, political science, and critical thinking. This class and year will be an especial memory for me.
Humbly,
Elias E.Q. DeLeon