Final Prediction
November 1, 2020
The Time for Uncertainty
I will try to keep this short and to the point.
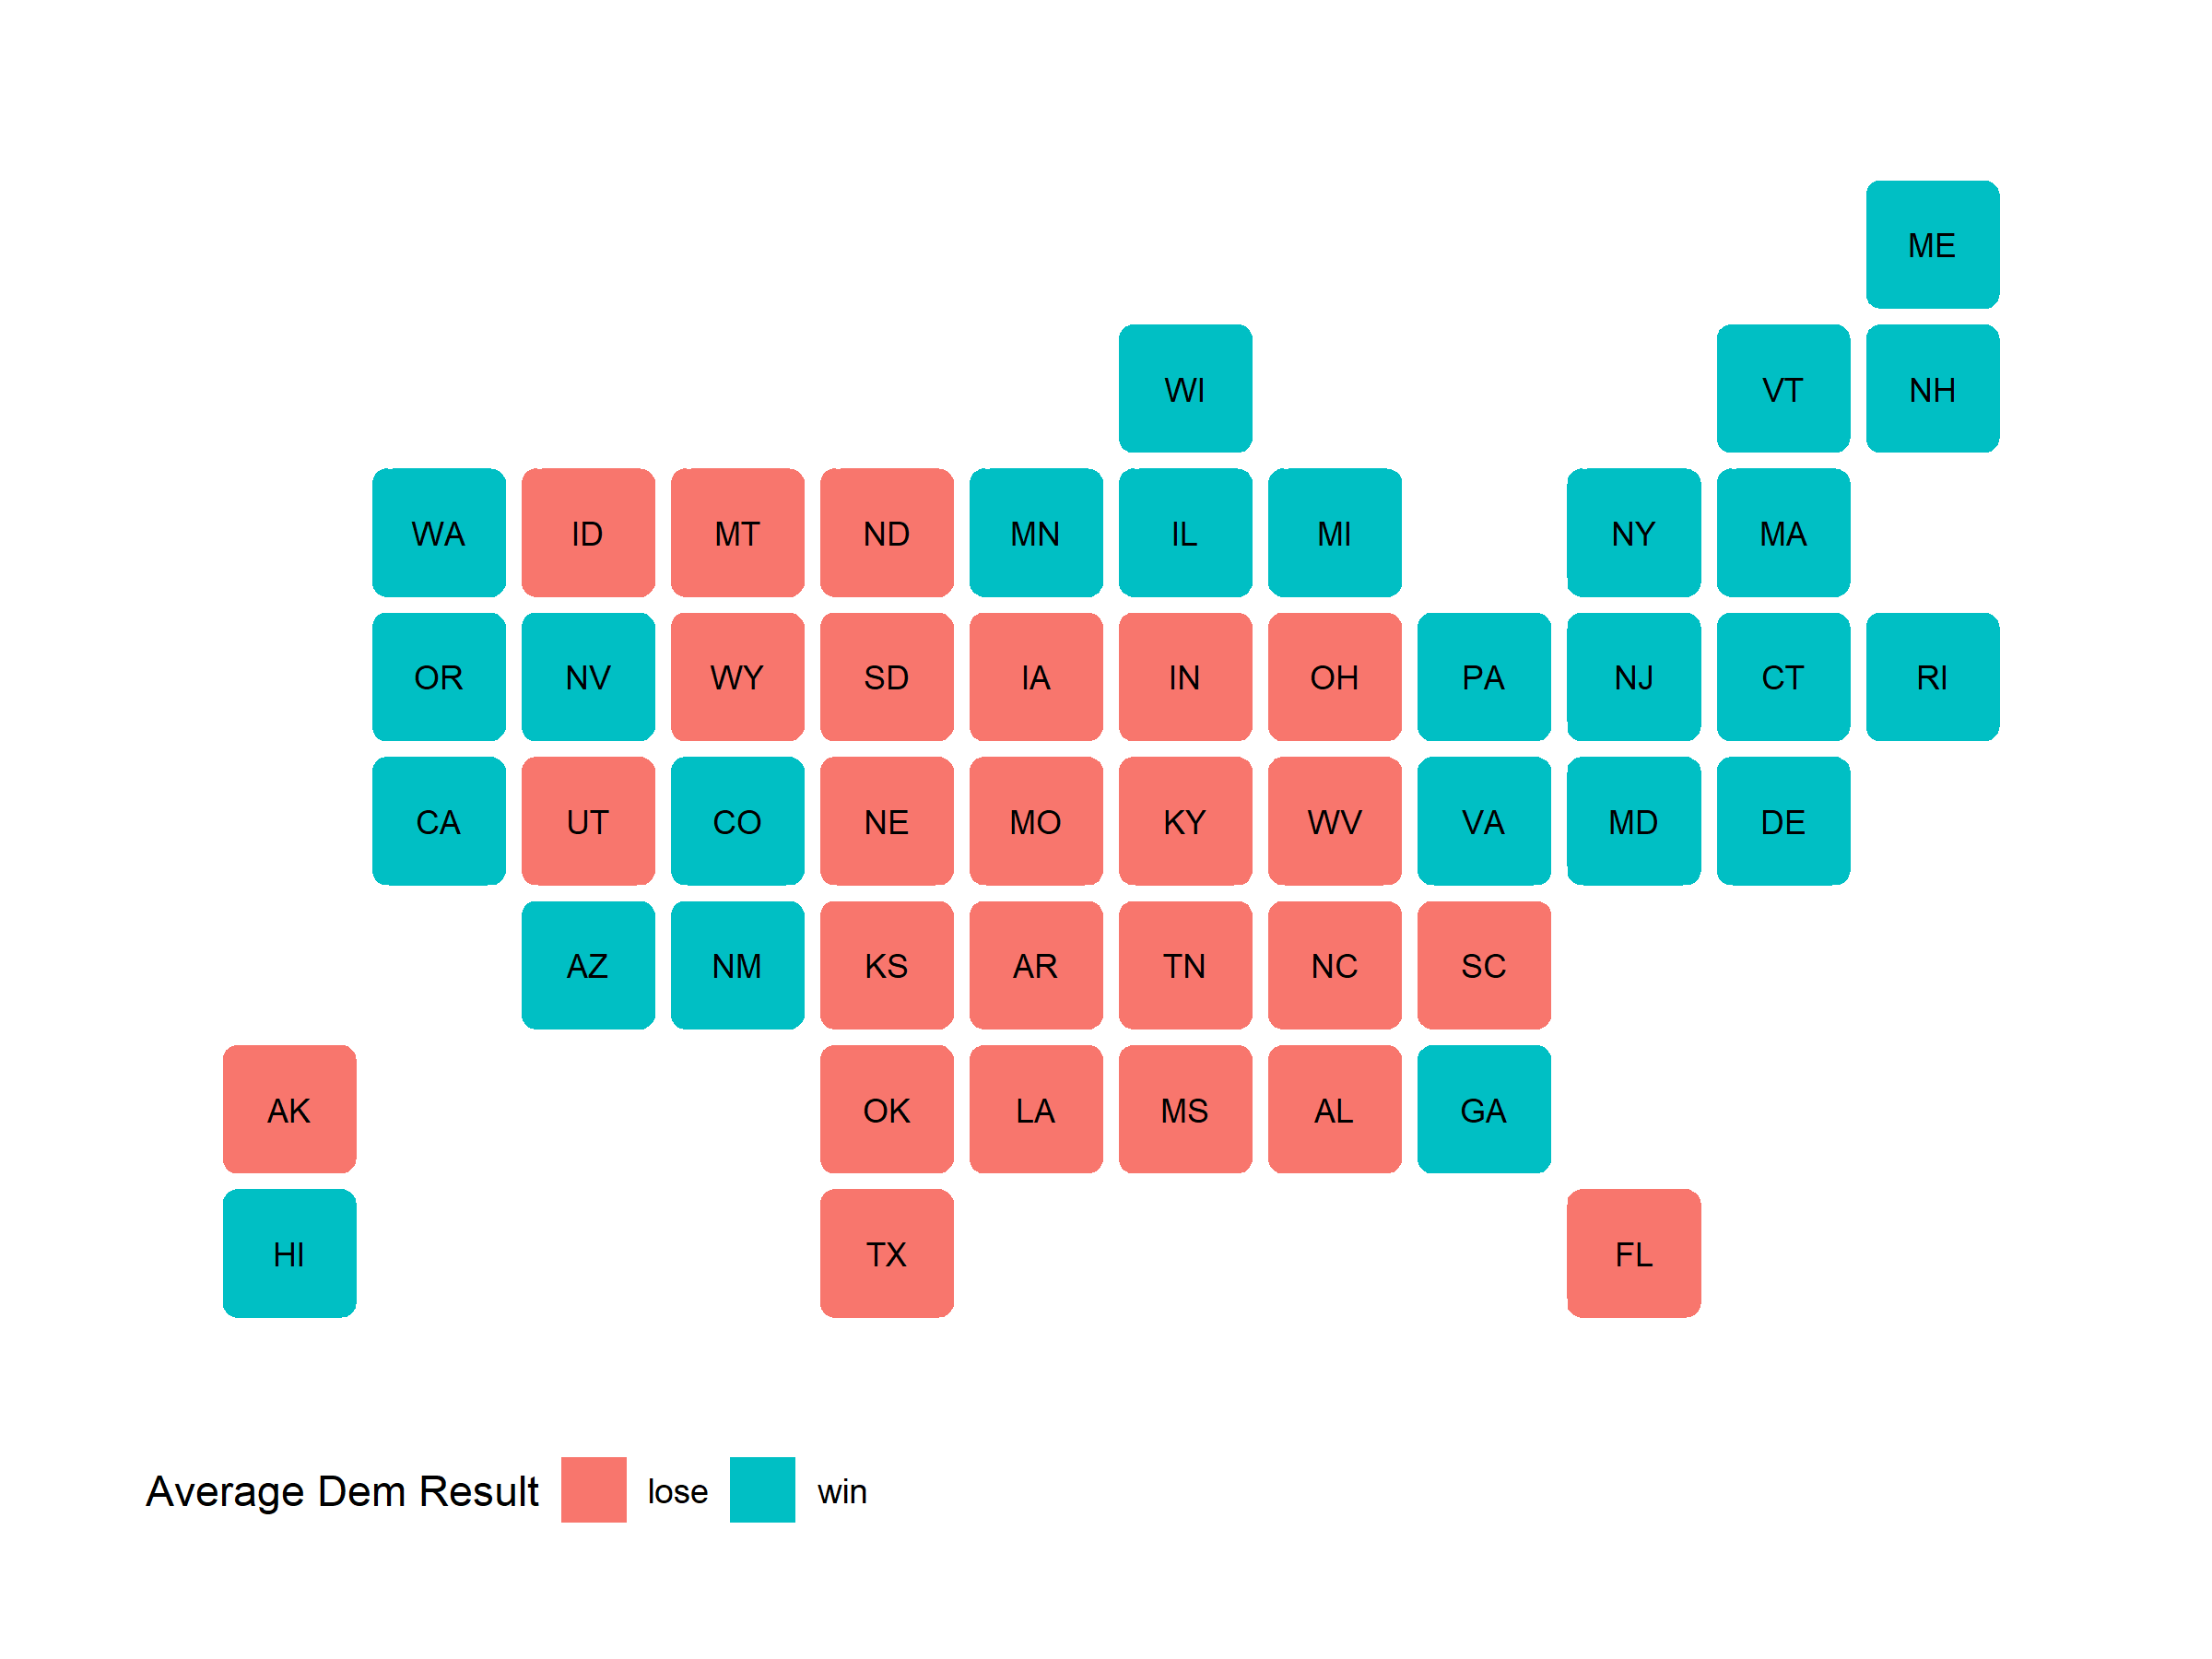
Average Predicted Electoral Vote share: Biden 353, Trump 185.
Average Simulated Election: State Results
The Model
I used a binomial logistic regression to obtain predicted probabilities of a single voter voting for Biden or Trump, and then ran trials across the entire likely voter population (LVP). Probability is the logic of uncertainty, so I wanted a model that could simulate uncertainty in the average voter. This type of model is well-suited for running simulations, so upon finding a distribution of vote probabilities for each party, I ran 10000 simulations of the election.
Notably, I did not use fundamentals data, for the simple fact that this year is a known outlier due to the sheer number of shocks, both politically and economically. To use economics-based regressions would overstate Biden’s advantage to an absurd degree. Thus, I opted for a metric that should somewhat reflect the net effect of all these influences on the people: polls and survey data. Ideally I would have liked to construct a weighting system based on poll quality, but there is an alluring simplicity in raw polls.
I ran a regression for each combination of state and party, but each is simply the number of party votes run against state raw poll averages between 3 days and 5 weeks before the election. I also randomized turnout and introduced variance to the regressed vote probabilities, each following a Normal distribution. I cannot summarize every regression coefficient, but generally the effect of polls is small but highly statistically significant. To give an example of Republicans in Pennsylvania, each point in the state poll average would correlate to a roughly 1.5% chance for someone to vote Republican.
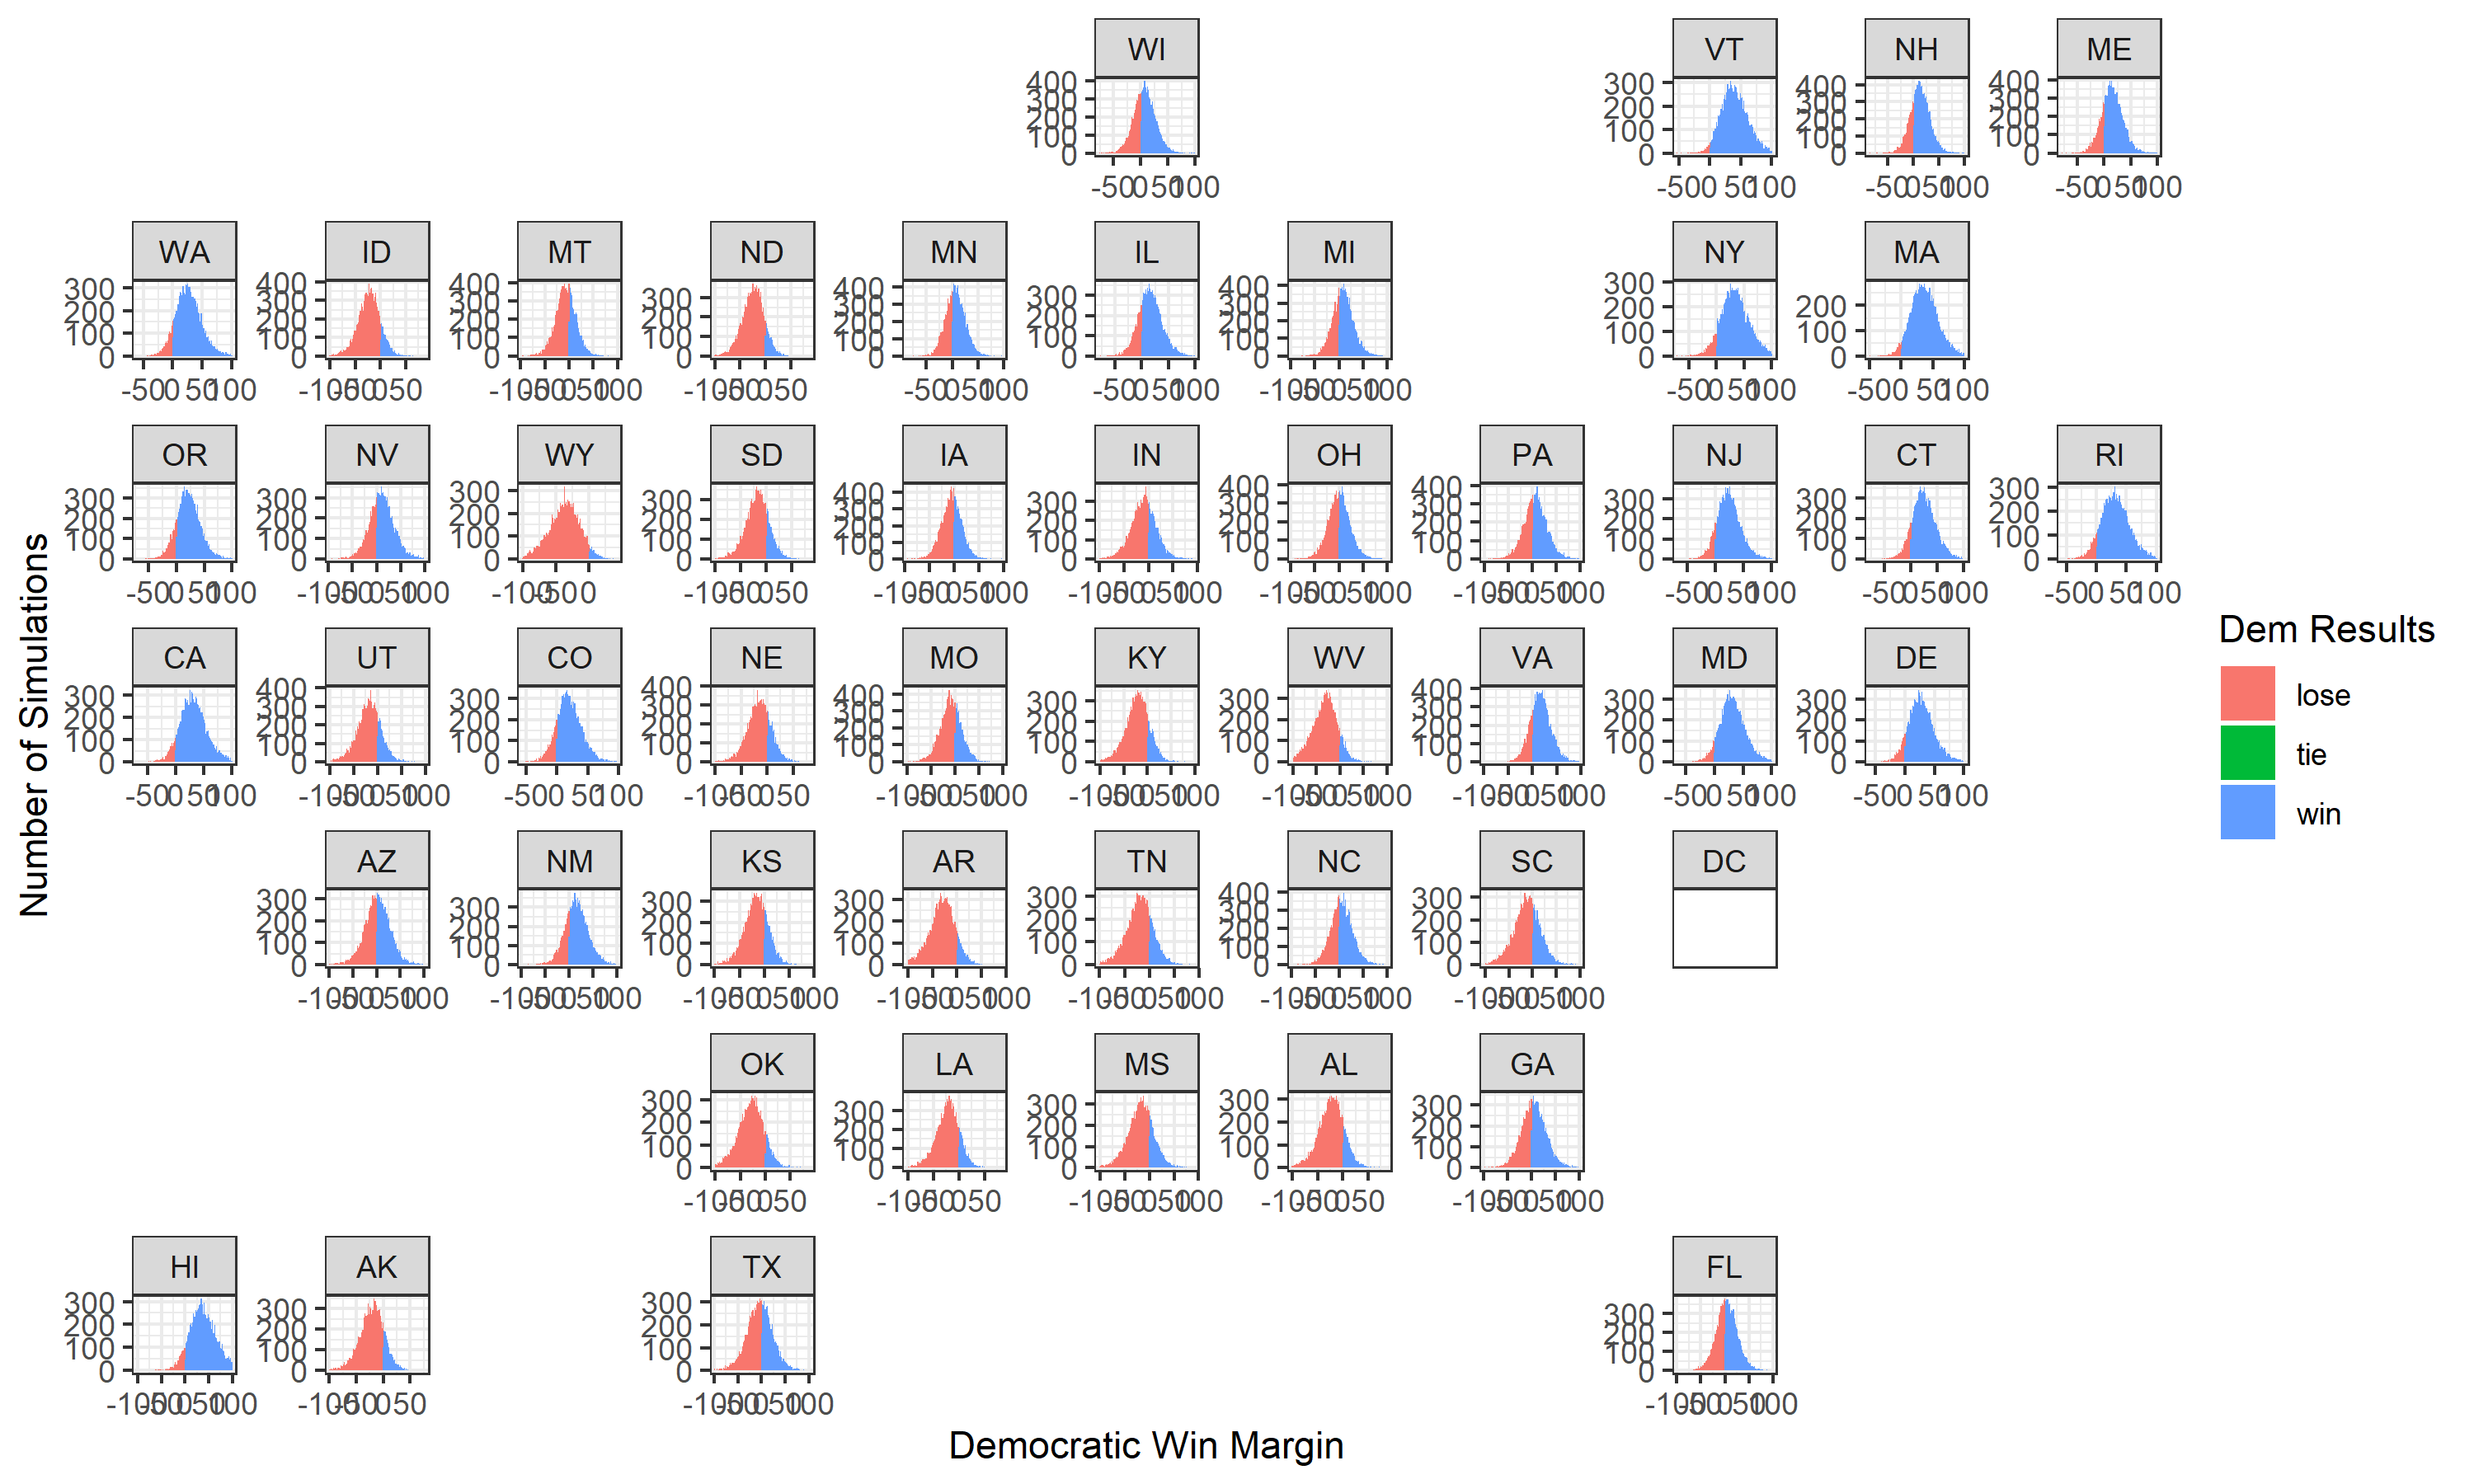
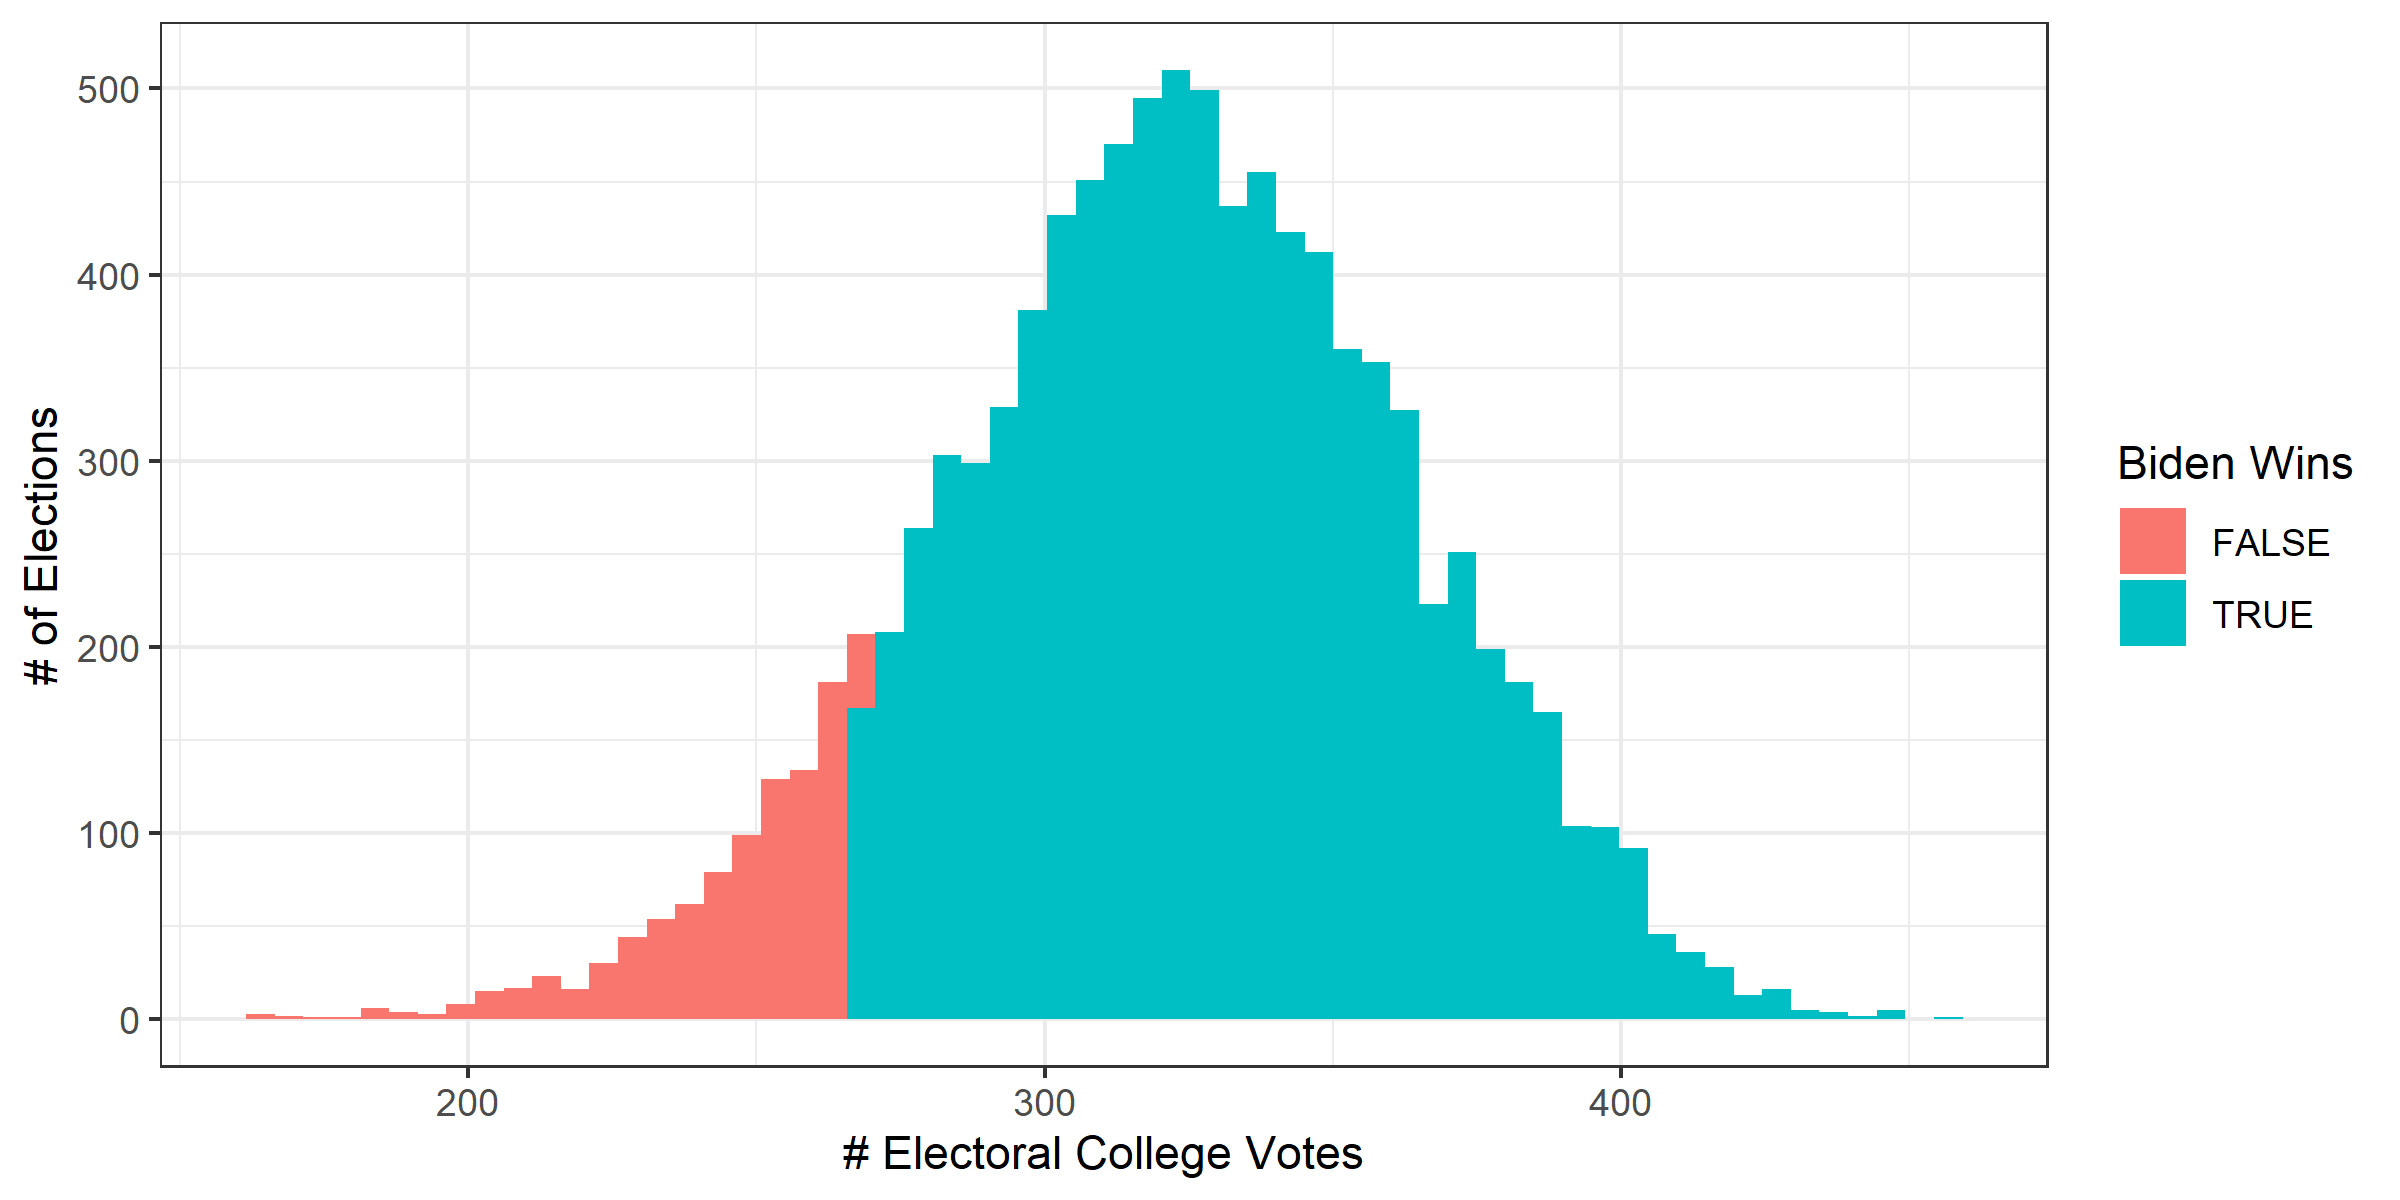
Visualizations for 10,000 Election Simulations
2020 Predicted Vote Share Distribution by State: 10,000 Simulations
2020 Electoral College Results Distribution: 10,000 Simulations
Limitations
Luckily, my method of simulating individual elections and aggregating them inherently shows the uncertainty in my model, in the form of probabilities and proportion of elections won. That said, it is important to note that this is an overly certain model created by quite the amateurish forecaster. As I have mentioned in previous weeks, I come up short in many ways in my best attempts to model elections. But taking all of my results with a large grain of salt, I can say that this has been an absolute joy of a journey.
Until the election, Elias DeLeon
Data Sources
Soubhik Barari & Sun Young Park (Gov 1347 TAs):
- VEP data for 1980-2016 elections
- Turnout data for 1980-2016 elections
- State popular vote share data for 1948-2016 elections
- State poll averages for 1968-2016 elections
Nate Silver (Founder, Head Analyst of FiveThirtyEight):