Shocks
October 24, 2020
Shocks: Should We Account for the Unpredictable?
This election cycle has been marred by uncountably many unforeseen events. To name a few:
- The third presidential impeachment in American history
- The worst pandemic in a hundred years
- The voluntary shutdown of the national economy (and the following deep recession)
- A police killing that sparked months of protests, riots, and racial reckoning
- The death of Ruth Bader Ginsburg and the rancor and perceived hypocrisy of the Senate
- The incumbent catching COVID less than a month before the election
- One of the lowest quality debates in modern elections
- A fly landing on the Vice President’s head, uninterrupted, for two whole minutes
- The attempts and achievements by foreign governments to interfere with American elections
The zeitgeist is unrest, and disturbance after disturbance make every election analyst shudder to think of the models. How do shocks affect voter behavior, and how do we account for them in our models? By nature singular and unexpected, should we even try?
This blog post seeks to consider just one of these shocks, COVID-19, and assess its viability in a model.
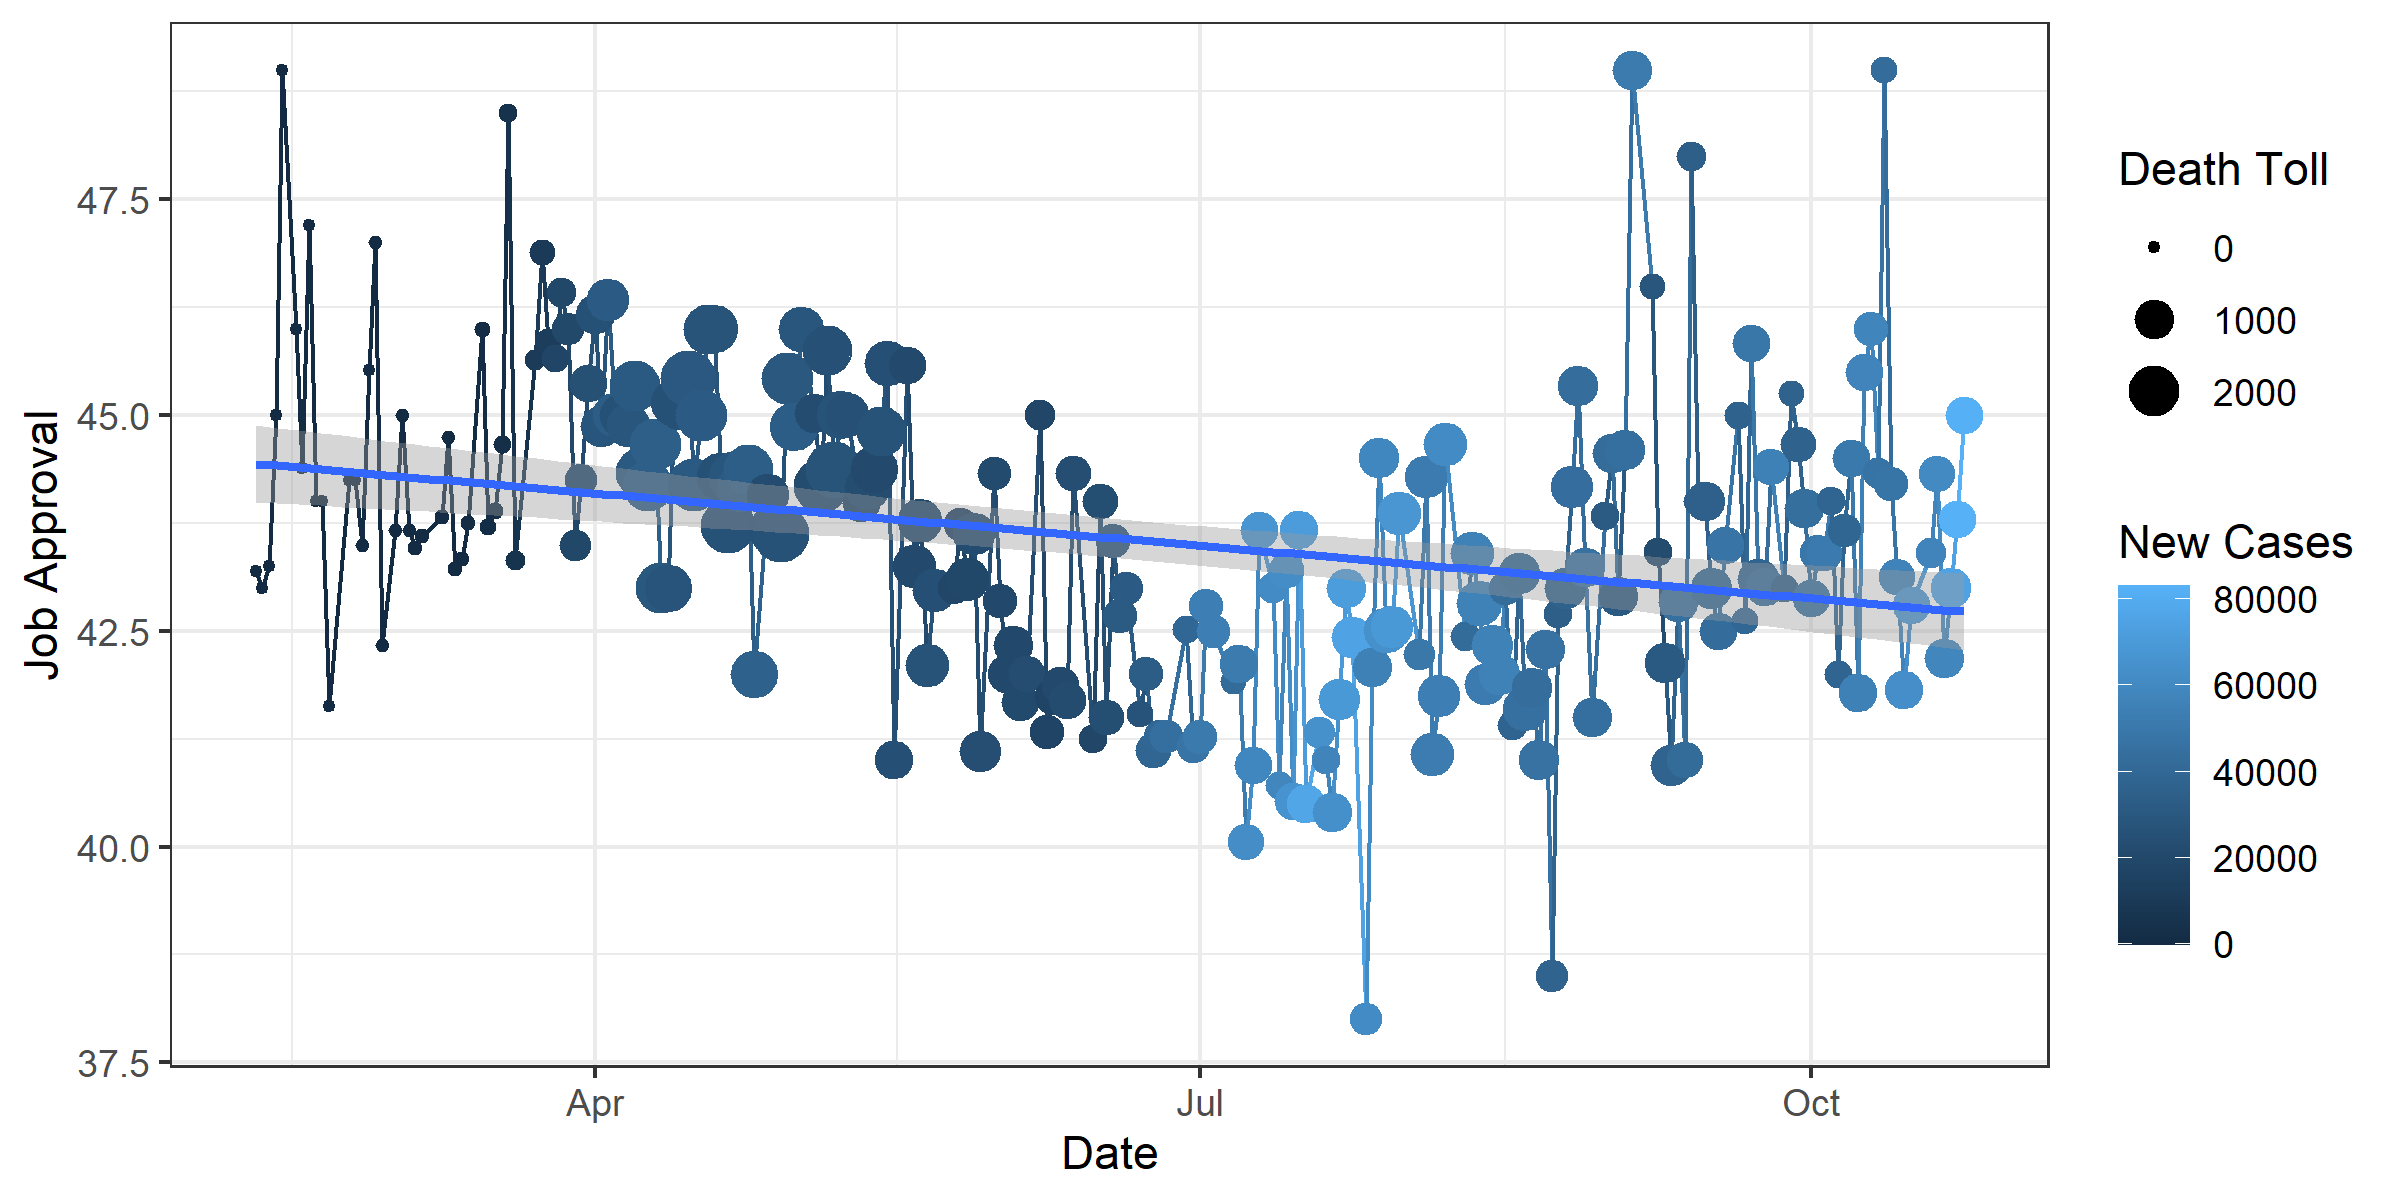
Job Approval by Date, Death Toll, and New Cases

A few things are noticeable here:
- Trump’s approval rating decreased drastically over the initial months of the pandemic. This could be explained by the quarantines that occurred in many states that isolated families, greatly restricted social interaction, shut down large sectors of the economy, and was precursored by the largest density of deaths in the graph. The fear, boredom, and festering resentment felt by many Americans towards the Trump administration’s perceived mishandling of the pandemic could have manifested in lower approval ratings.
- But his approval rating is slowly rising despite high amounts of new cases. The pandemic hit its peak around early July, and by August many lockdowns were either ended or relaxed. This is what I believe caused the large increase in new cases around that time. As public parks and businesses gradually re-open in limited capacities, it may be that any return to normalcy is welcomed warmly. I say all this because I believe that voters’ behavior is tightly related to their welfare. This graph suggests one of two things: a) that deaths rather than new cases affect voter perception of Trump, or b) that lockdowns and recessions depress the American psyche, which manifests as a lower favorability for the incumbent.
Summary of Multivariate Regression: Job Approval by Total Deaths & New Cases
Call:
lm(formula = yes ~ death + positive, data = covid_app)

Residuals:
    Min      1Q  Median      3Q     Max
-5.1435 -1.1037 -0.0211  0.9292  5.7631

Coefficients:
              Estimate Std. Error t value Pr(>|t|)
(Intercept)  4.491e+01  2.013e-01 223.106  < 2e-16 ***
death       -3.877e-05  5.356e-06  -7.239 7.75e-12 ***
positive     8.578e-07  1.429e-07   6.002 8.11e-09 ***
---
Signif. codes:  0 ‘***’ 0.001 ‘**’ 0.01 ‘*’ 0.05 ‘.’ 0.1 ‘ ’ 1

Residual standard error: 1.543 on 217 degrees of freedom
Multiple R-squared:  0.2325,	Adjusted R-squared:  0.2254
F-statistic: 32.86 on 2 and 217 DF,  p-value: 3.408e-13
I ran a regression using these statistics and found a weak, but very much present, Adjusted R-squared value of 0.225. I believe this regression may be slightly in error however, as it implies more COVID-19 cases is favorable for Trump, though of much less magnitude than death tolls harm his approval.
Additionally, I checked correlation coefficients of disapproval with total deaths, new cases, and new tests and found non-trivial values of 0.368, 0.346, and 0.370 respectively. Admittedly, the coefficients are smaller when run against approval, but for disapproval the correlation is non-negligible.
Predictions
Despite all this, I am wary about accounting for COVID-19 in any substantial way, for the same reason I am wary this election cycle about using economic data. This is a year whose constellation of upheavals will be studied for generations, so I will be humble in my weights and leave it to other, better, and future forecasters to try their hand.
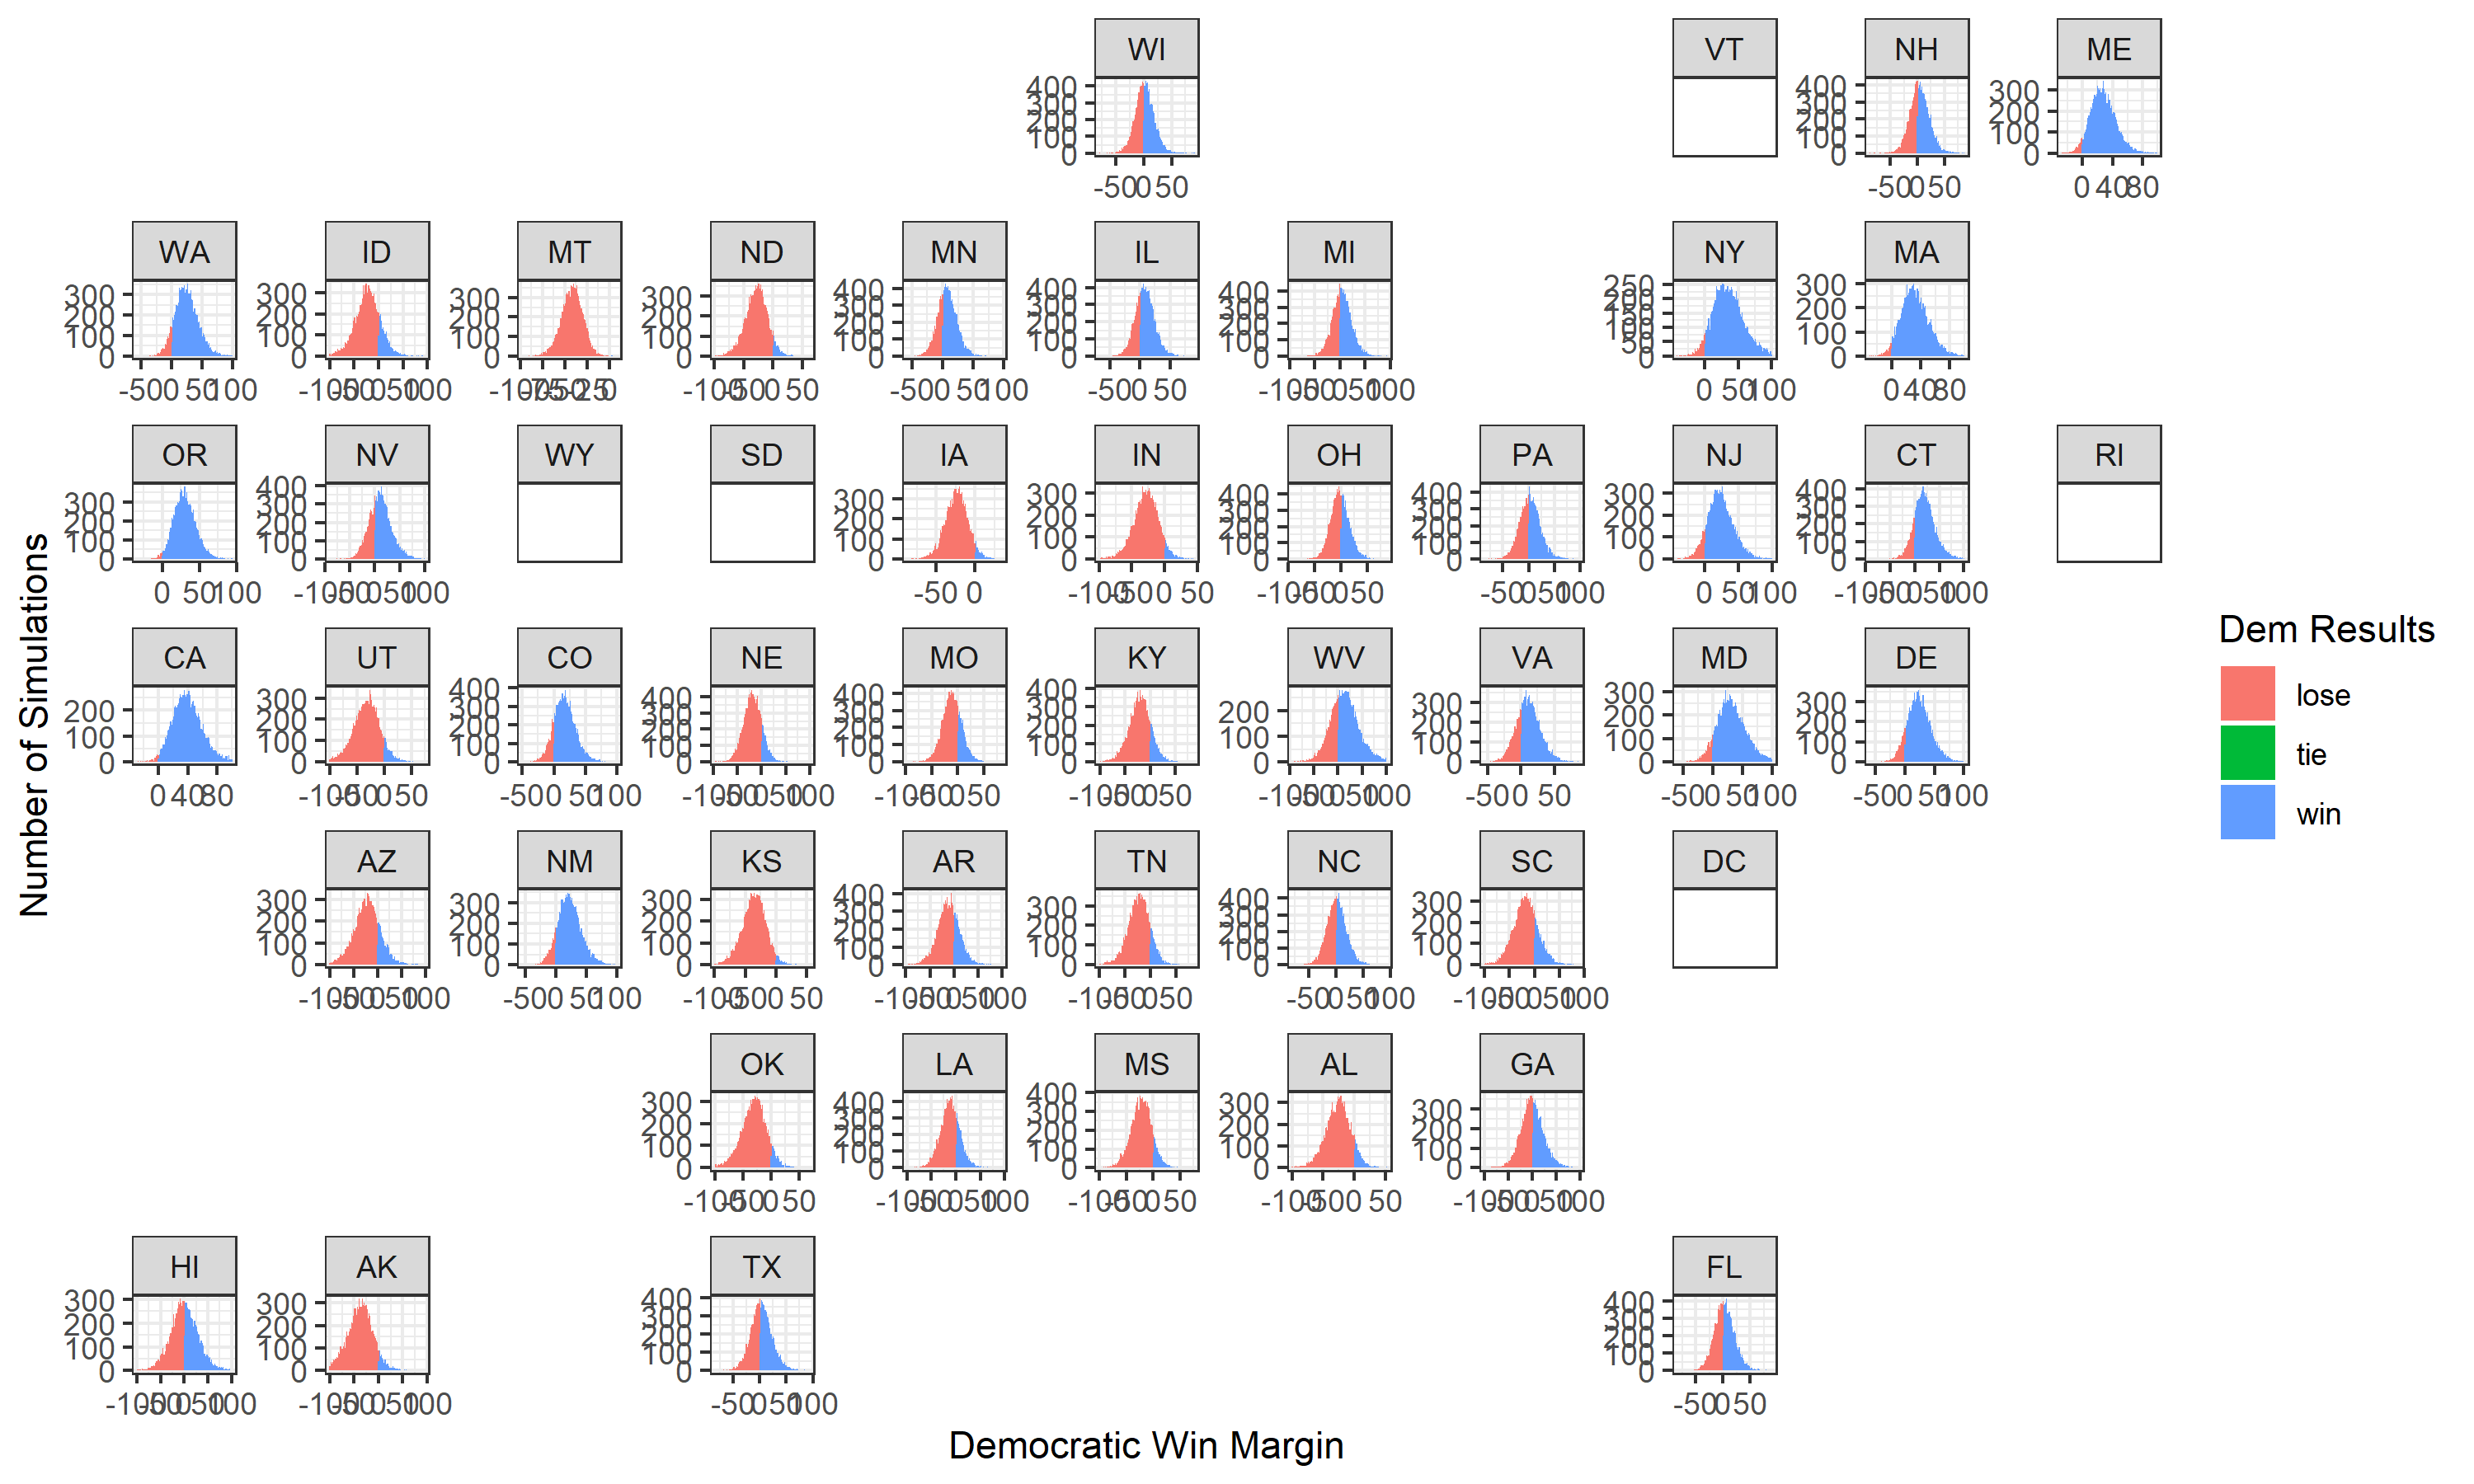
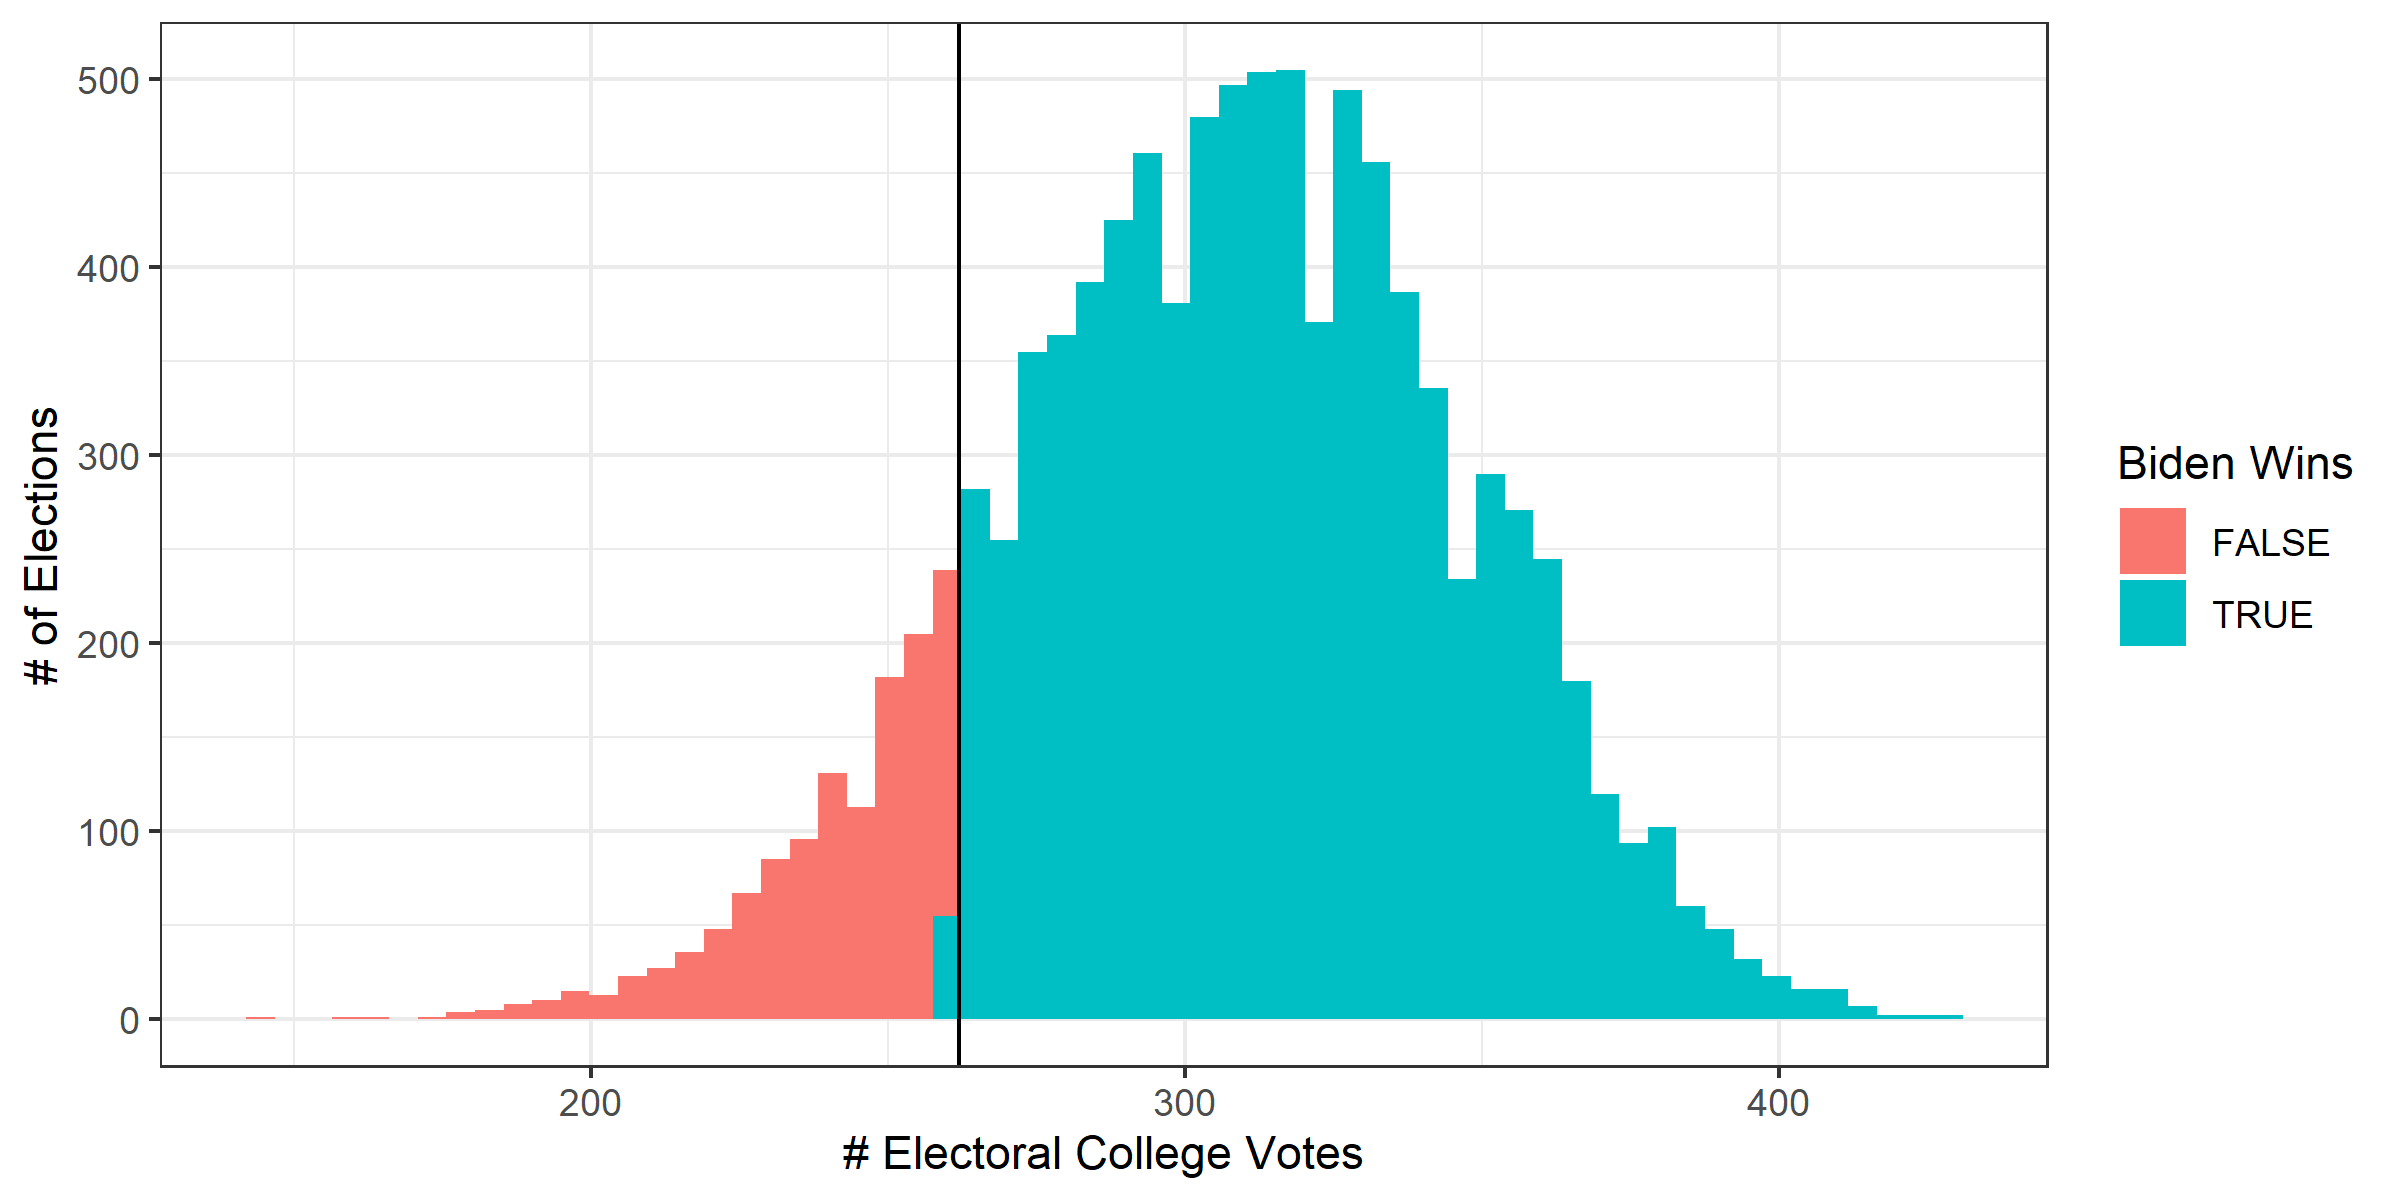
That said, the change I made was to depress overall turnout nationwide as the net effect of COVID-19 deterring physical voting and the move to mail-in ballots. My guess is that these net effects differ by party: Republicans seem less likely to have the fear of contracting COVID-19 deter them from physical voting, and similarly less likely to use mail-in ballots. This guess comes from party lines that COVID-19 is much less of a risk than is portrayed by the media, and that mail-in voting has a high potential for fraud and discounting. For Democrats, these impulses are reversed, seeming more likely to resort to mail-in ballots than physical voting. I estimated the net effects to be 5.1% decreased turnout for Republicans and 10.4% decreased turnout for Democrats, with Biden still winning with very high probability.
Newer-and-Improved 2020 Predicted Democratic State-Win Margins: 10,000 Simulations

Distribution of Electoral College Results: 10,000 Simulations

What would quite depress me in the end is if amidst all this change, these stirrings and unrest, the best predictor of the 2020 election was what came before, that we revert to instincts rather than hard reflection:
What the hell happened this year?
Funny Stuff
- Better call 2020 a tesla coil with all these shocks…
Data
- COVID Cases / Deaths
- Job Approval (Thank you Yao!)
- Presidential Polling Averages