Ground Game
October 17, 2020
The Ground Game: A Move to Mobilize
It is not enough for a presidential campaign to dominate the air war; it must also win the ground game for a chance at total victory. That said, like last week, I devoted significantly more time to updating my binomial regression-based simulations. That said, I would like first to discuss two interesting points from Darr and Levendusky. The first is that 2004 represented a “sea change” in how campaigns organized in-person contact operations, so data prior to 2004 may not be so informative to modern election analytics. The second is that a campaign’s ground game, in the form of field offices, serves not so much to persuade swing voters as to mobilize core supporters.
While campaign data are descriptively rich, they are still, to me, predictively nascent, as we only have single-digit sample sizes from which to draw. Nevertheless, these fascinating issues of mobilization and turnout inform my updated simulations.
Voter Turnout in Presidential U.S. Elections 1980-2016
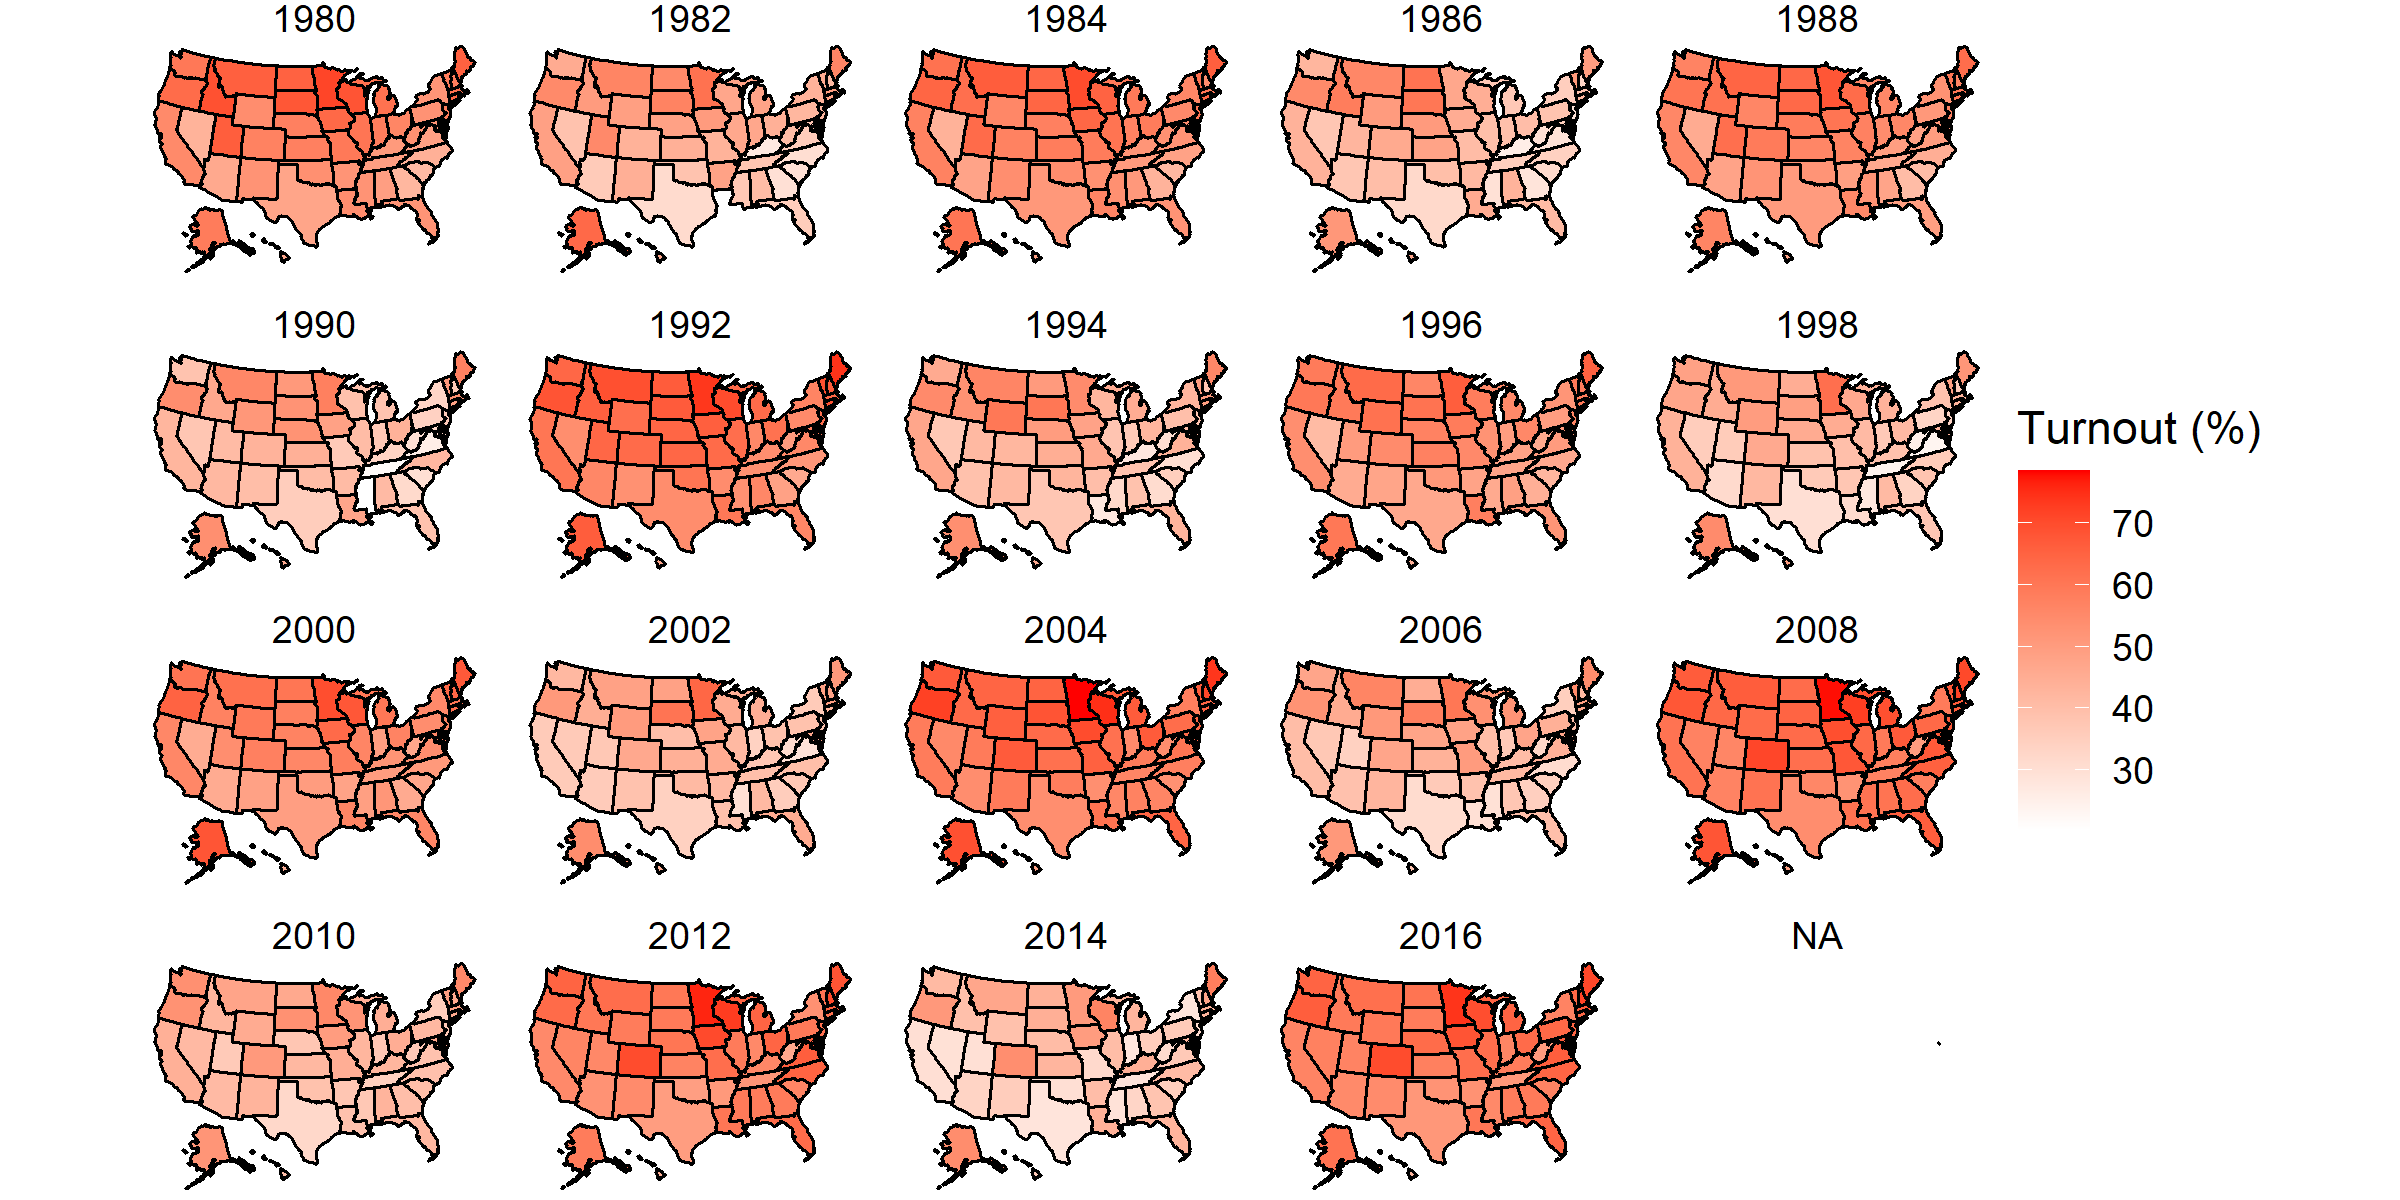
- Midterms are, consistent with common knowledge, less mobilized than presidential election years. So it is a fault of my analysis, then, that I included these categorically different turnout numbers in my calculations for the binomial regression-based simulations. I hope to fix this in a later post.
Prediction
Both FiveThirtyEight and The Economist have attempted to account for the unpredictability introduced to the election by things like COVID-19 and voting by mail. I believe Nate Silver’s holistic approach is laudable, given how many ripple effects he accounts for in his adjustments; his inclusion of news headlines, however, is less so due to the increased volume of important news over time for big newspapers. The Economist only adjusts economic data in a conservative way, which helps the model but will not fully capture the possible ramifications of COVID-19.
New-and-Improved 2020 Predicted Democratic State-Win Margins: 10,000 Simulations
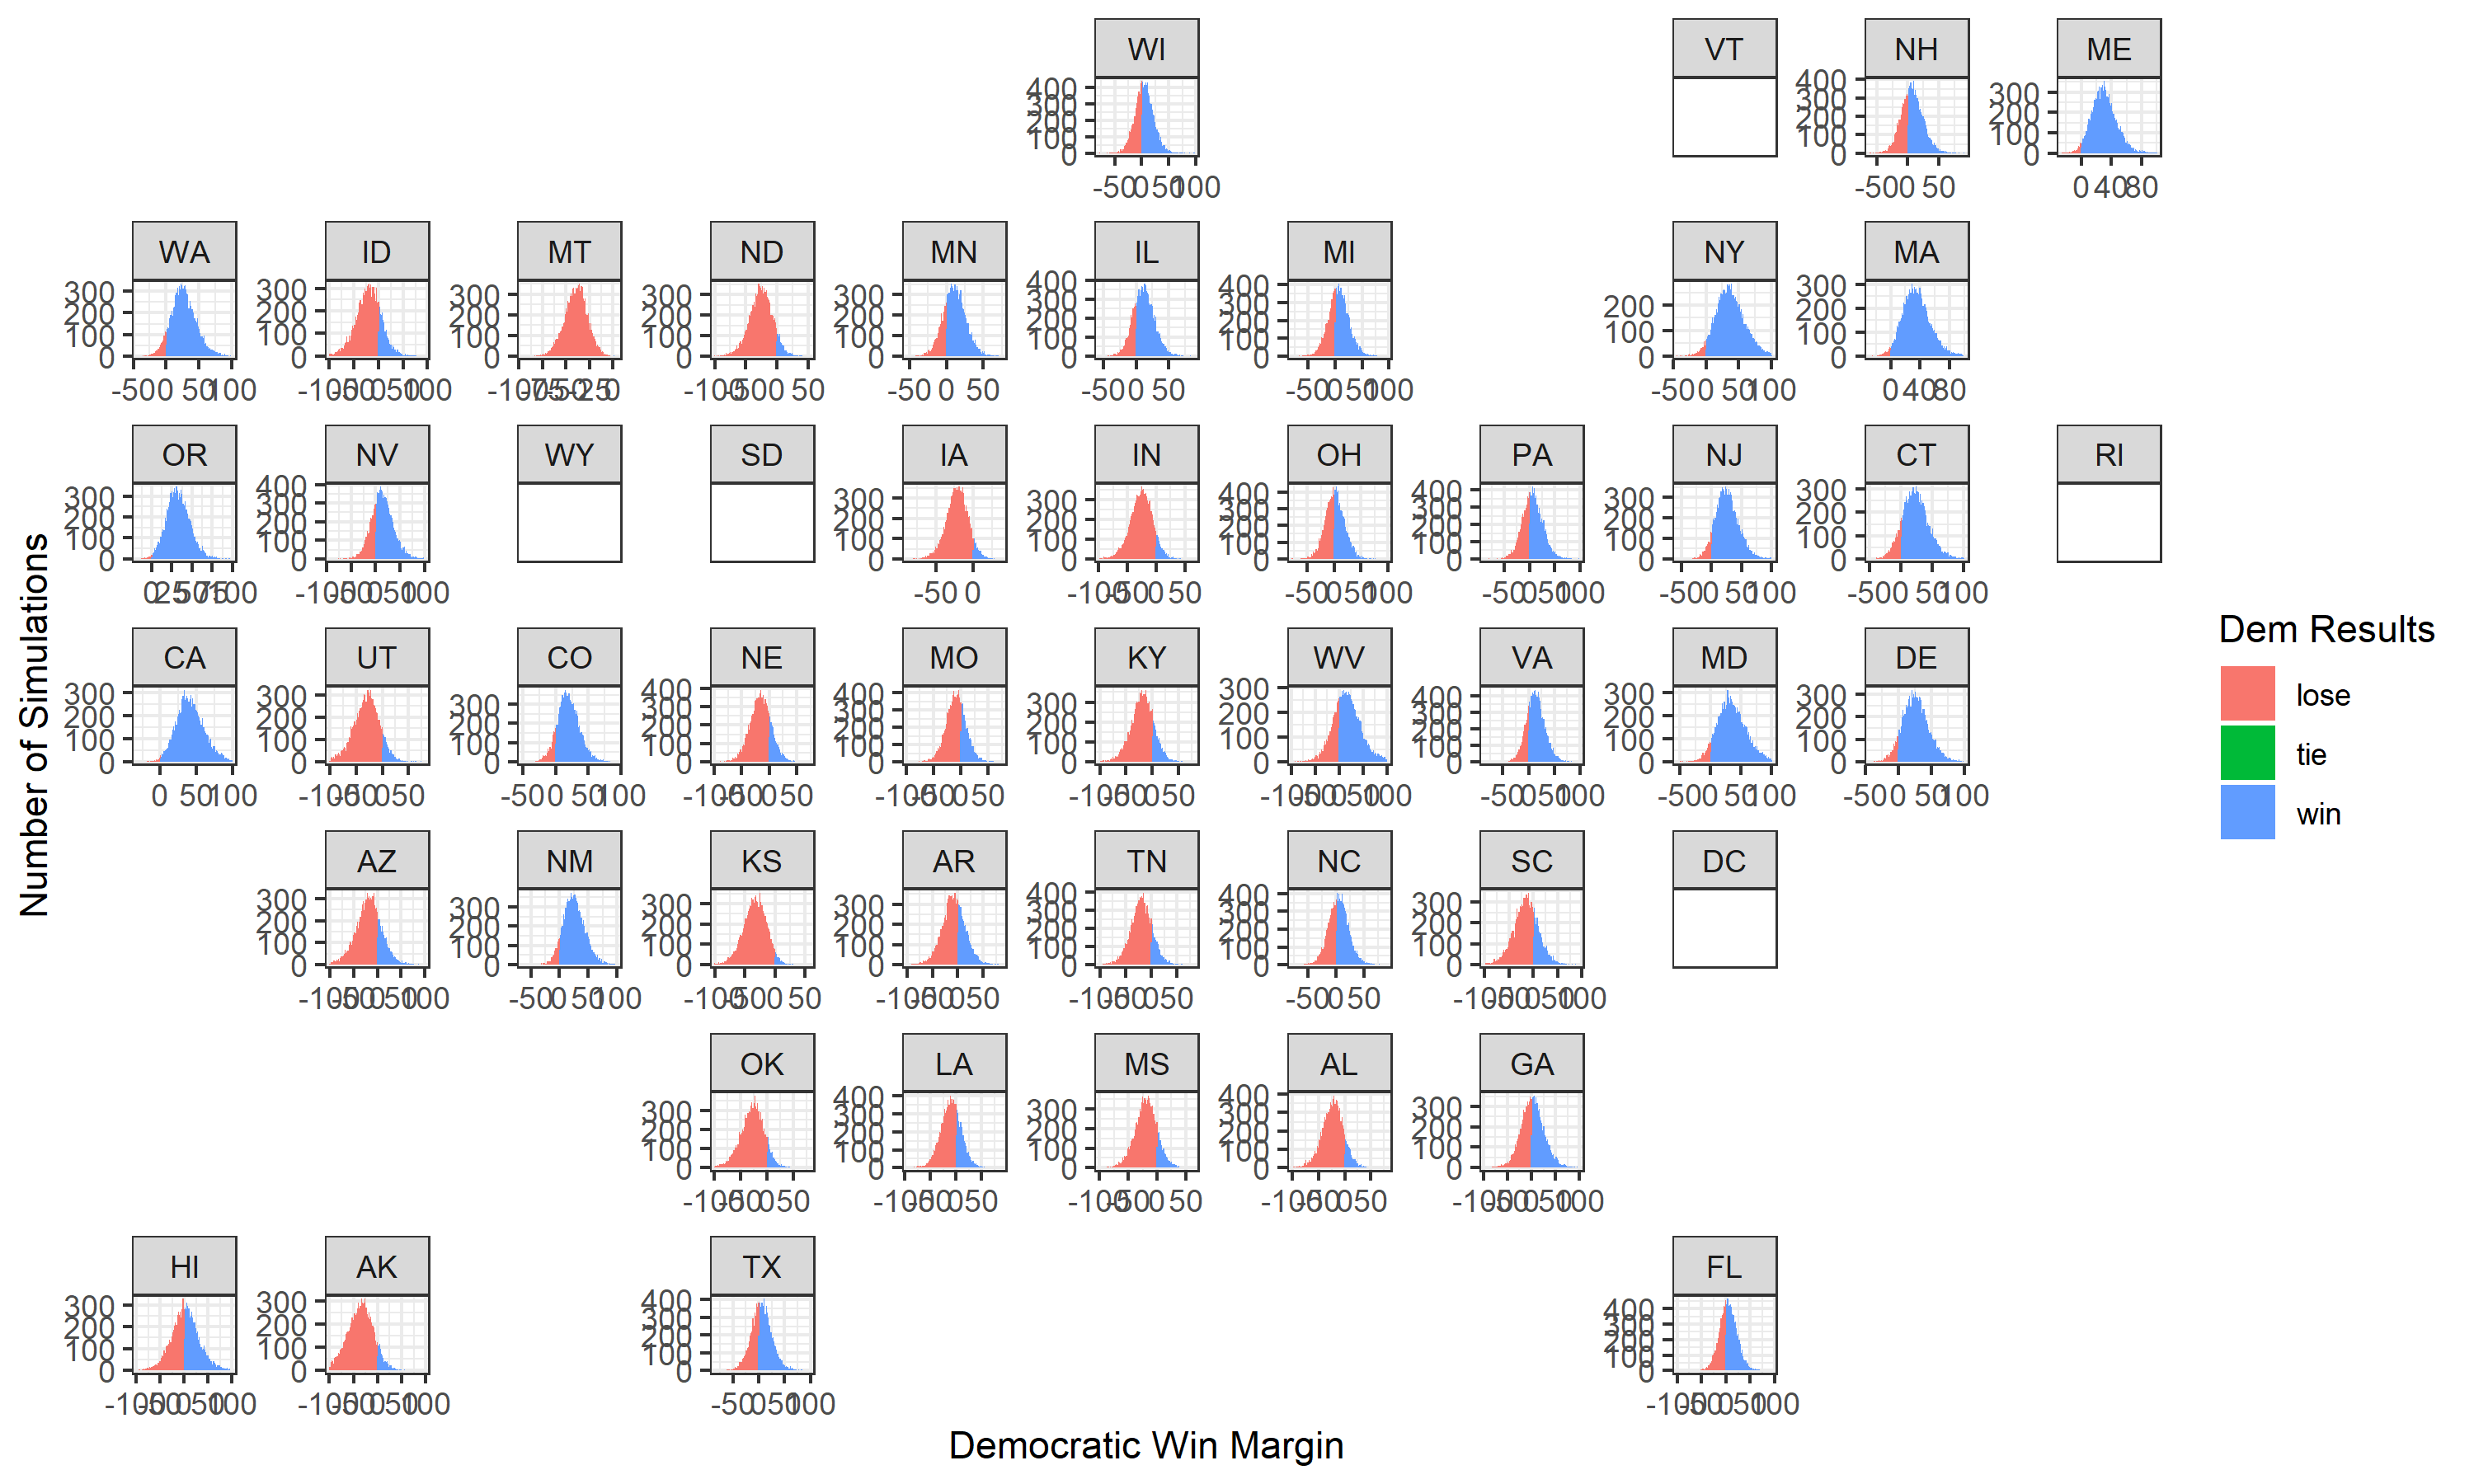
And we have variance! In addition to the use of a binomial distribution, I have employed normal distributions to introduce variance at the turnout and probabilistic levels. Additionally, due to a lack of time, I only introduced a combined effect of 0.9 on turnout due to COVID-19 and vote-by-mail. My reasoning for this is that the cost of voting for voters in vote-by-mail states is significantly reduced (+20%), and is only barely offset by COVID-19 because it hampers the primary method of voting (-30%): a 10% net loss for turnout.
The distributions for each candidate look at least historically plausible, and are regionally realistic. This model could use many minor tweaks, but I am ecstatic with the results! Biden wins in this particular set of simulations with 330 electoral votes, given the same assumptions as last week.
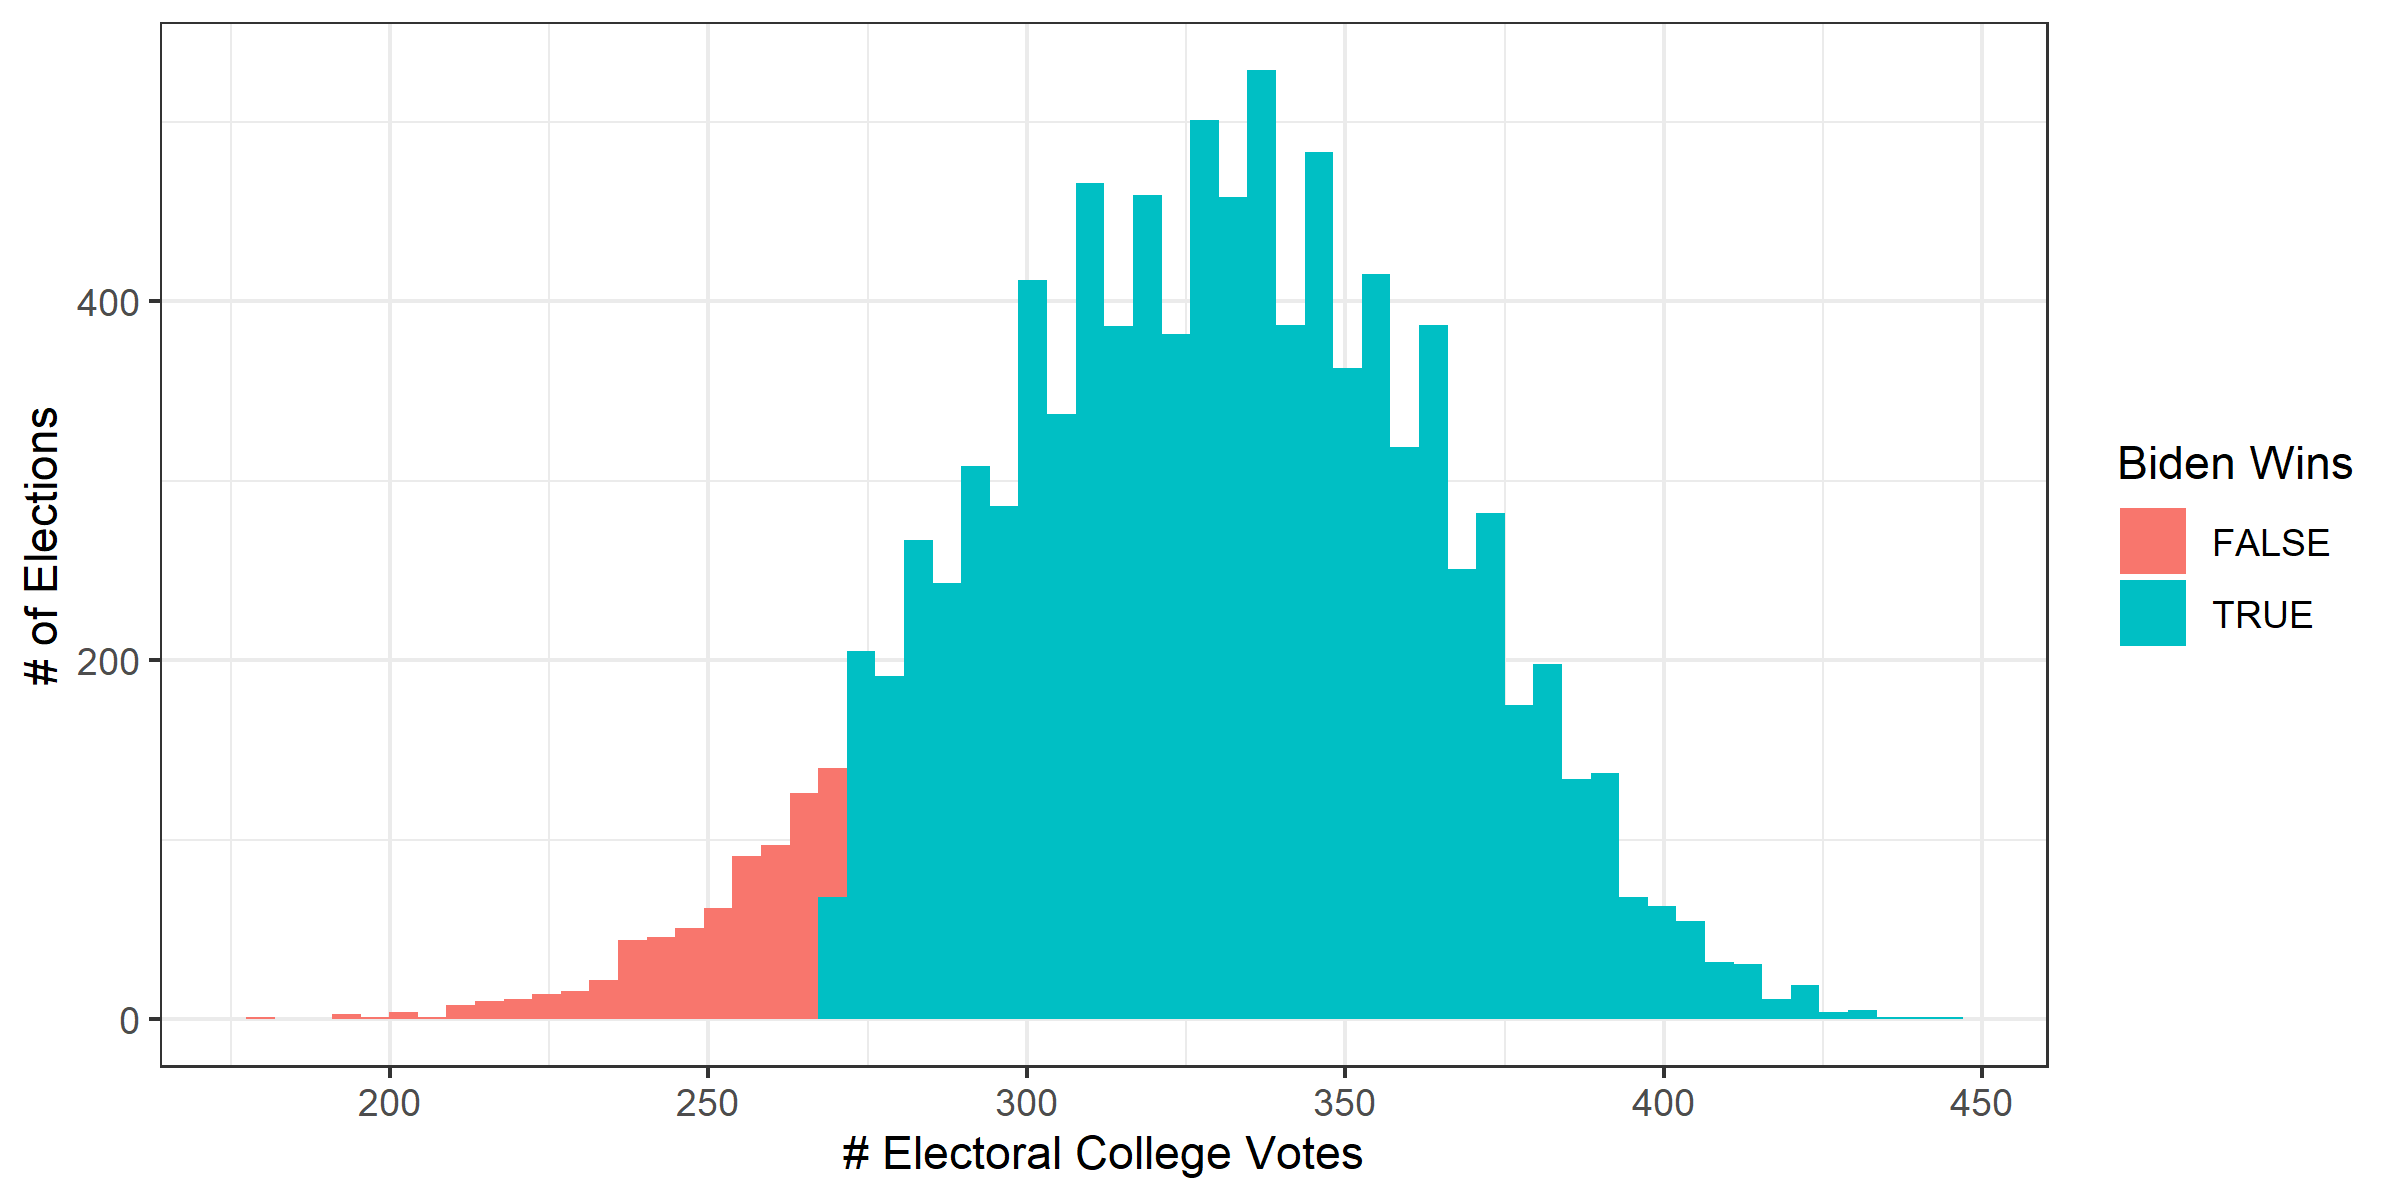
Update: I realized that because my graph has variance now, I need to calculate Biden’s electoral votes in each of the 10,000 simulations. I created a histogram to that end below. I’m having so much fun in this class!
Distribution of Electoral College Results: 10,000 Simulations
Funny Stuff
- There was a singular “tie” outcome that haunted my simulations and messed up the color scheme. Not only that, but it jumped between states as hosts. Spooky.