Air War
October 10, 2020
The Air War:
Though this week is about the “air war,” fought between dueling presidential campaigns in TV, radio, and digital ads, I focused more on working on a state-level probabilistic model based on binomial regression-based simulations. That said, I first would like to make a few comments on what is widely considered one of the best campaigns run in modern politics: the 2008 Obama campaign.
Campaign Ads Aired By Issue and Party: 2008
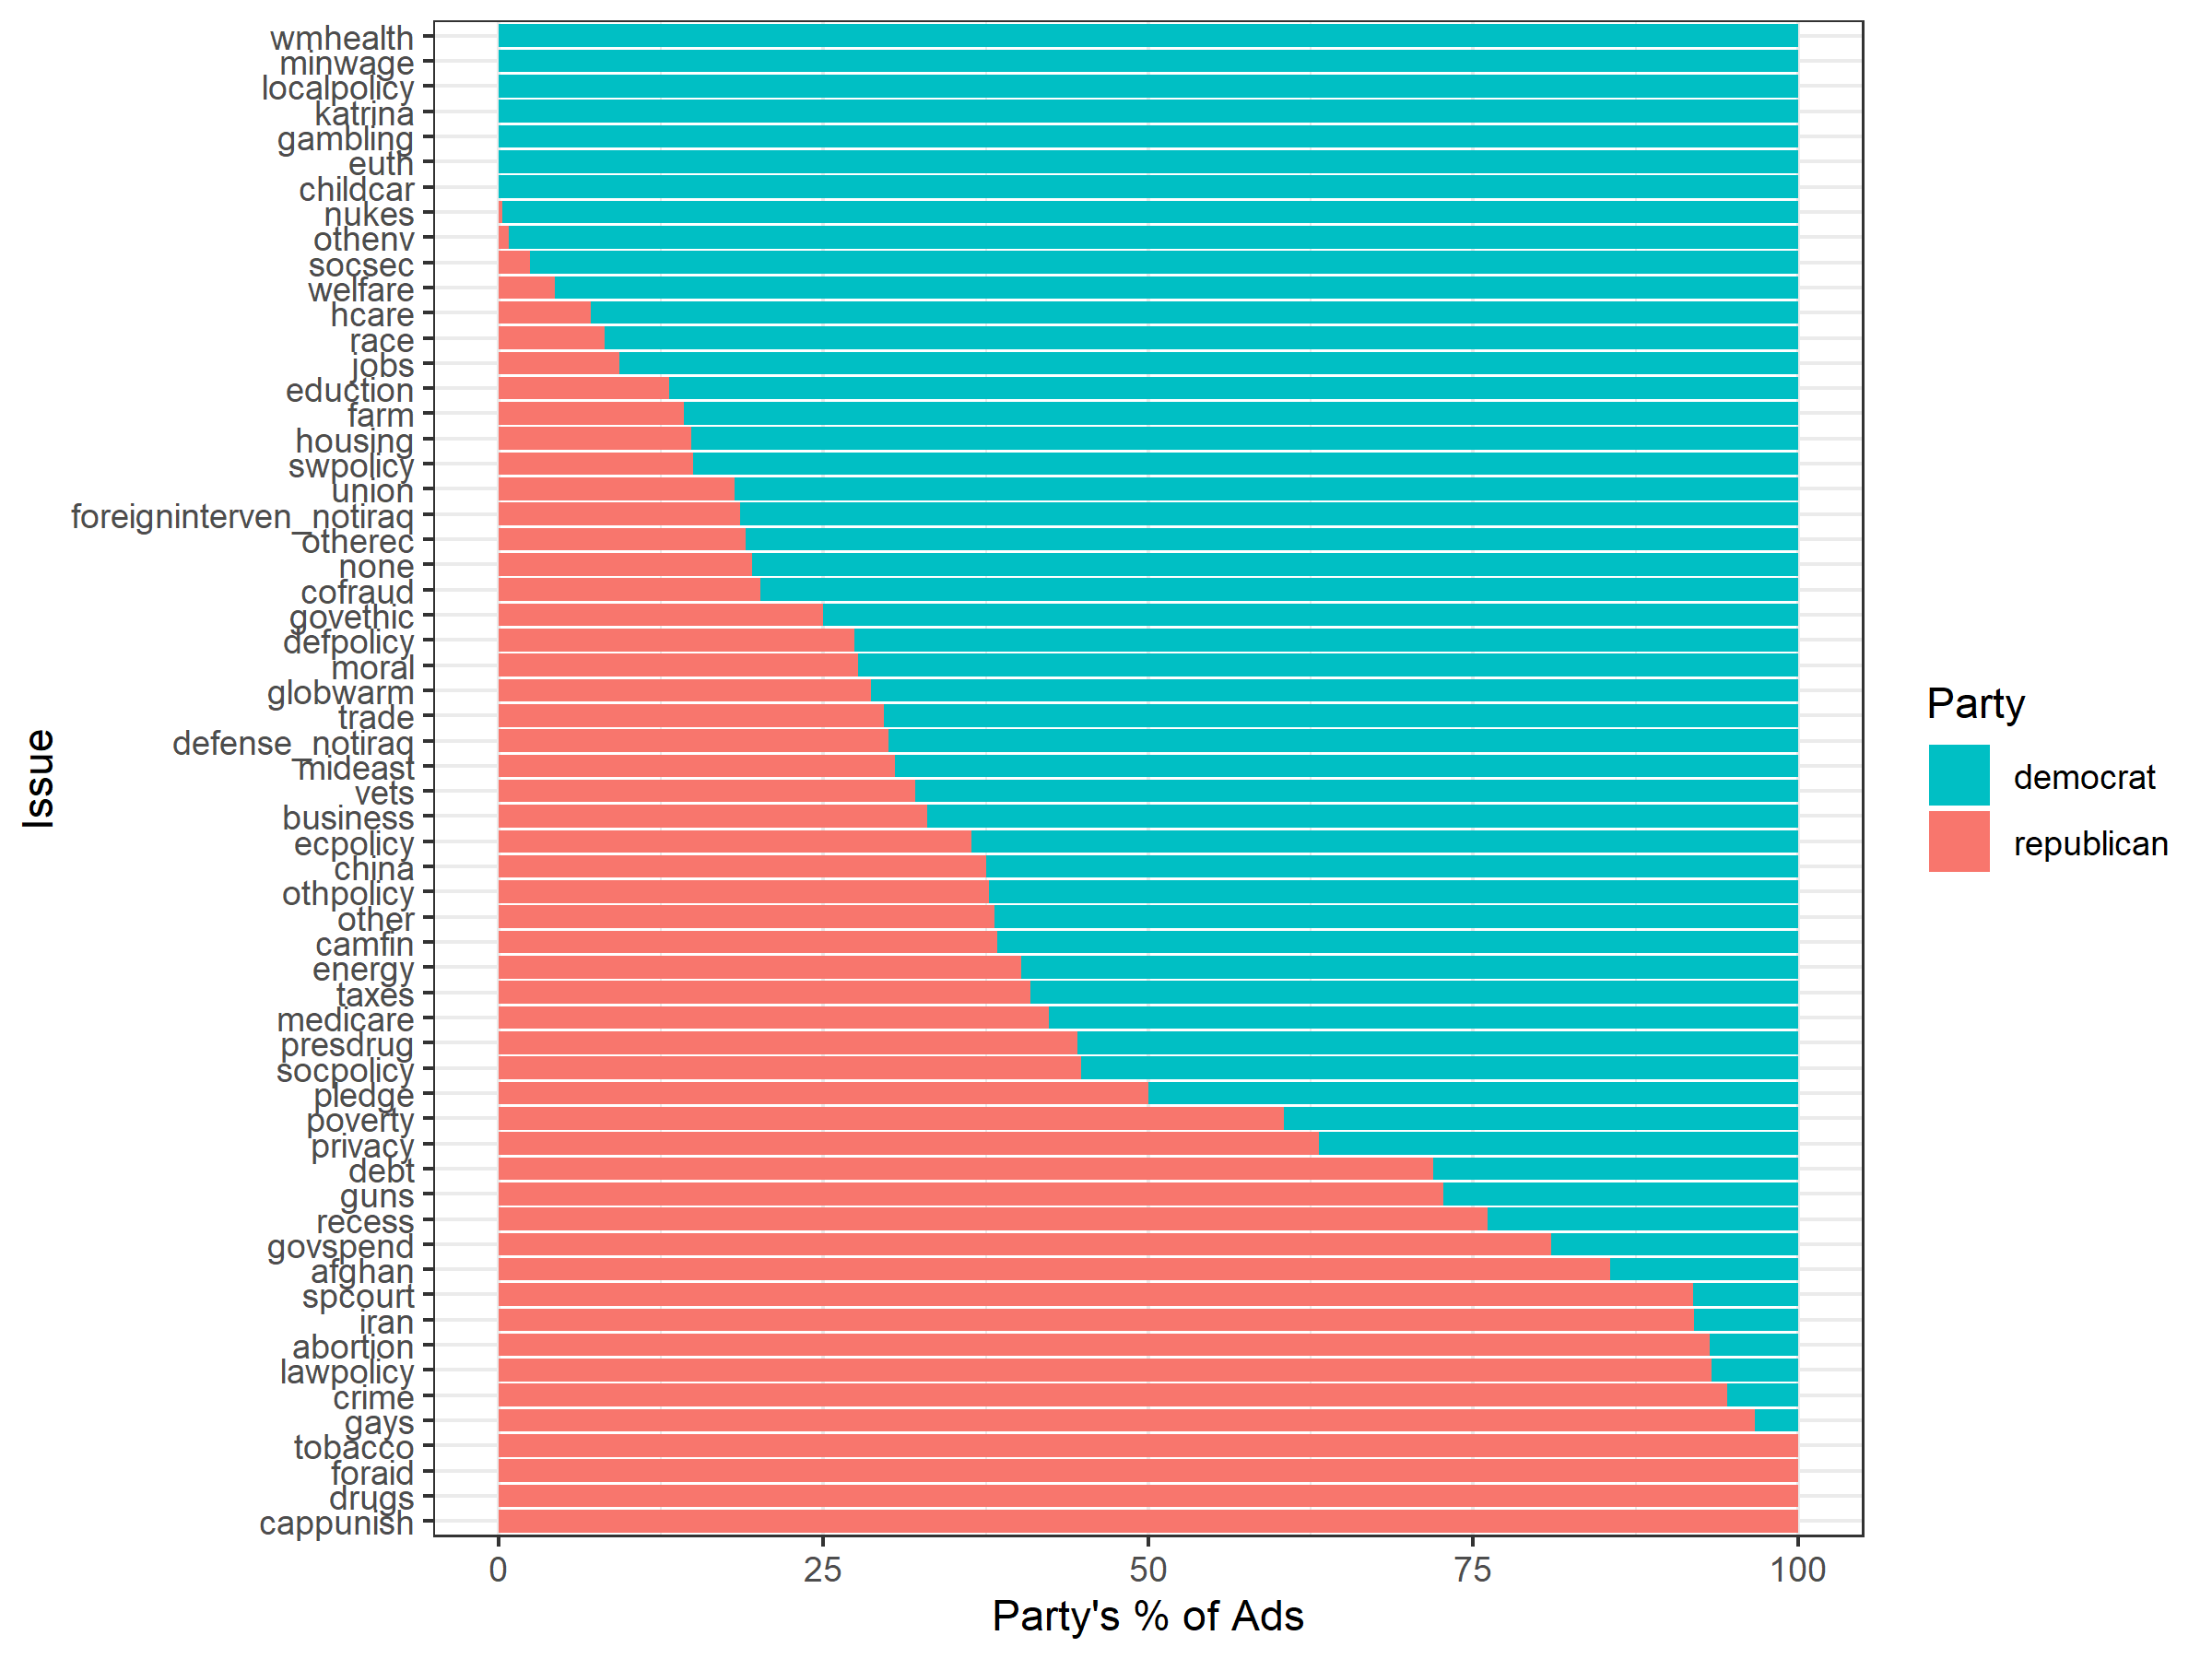
- Ads play along issues salient along the party line.
- Obama focused more on contrast ads than attacking McCain
- Obama’s team trounced the McCain campaign on total ad spending.
Prediction
The meat and potatoes of my effort, however, went into making a state-level probabilistic model. It is a binomial regression, using polling averages five weeks out from the election, both for the 2020 prediction and the data the model ran on. Going forward, I will not be including ad data in my predictions. The reason for this is that the data provided is very sparse–we can only go back 4 elections– and given that ads have a limited affect (at least non-cumulatively), I will be sticking with my polls-only model.
2020 Predicted Democratic State-Win Margins: 10,000 Simulations
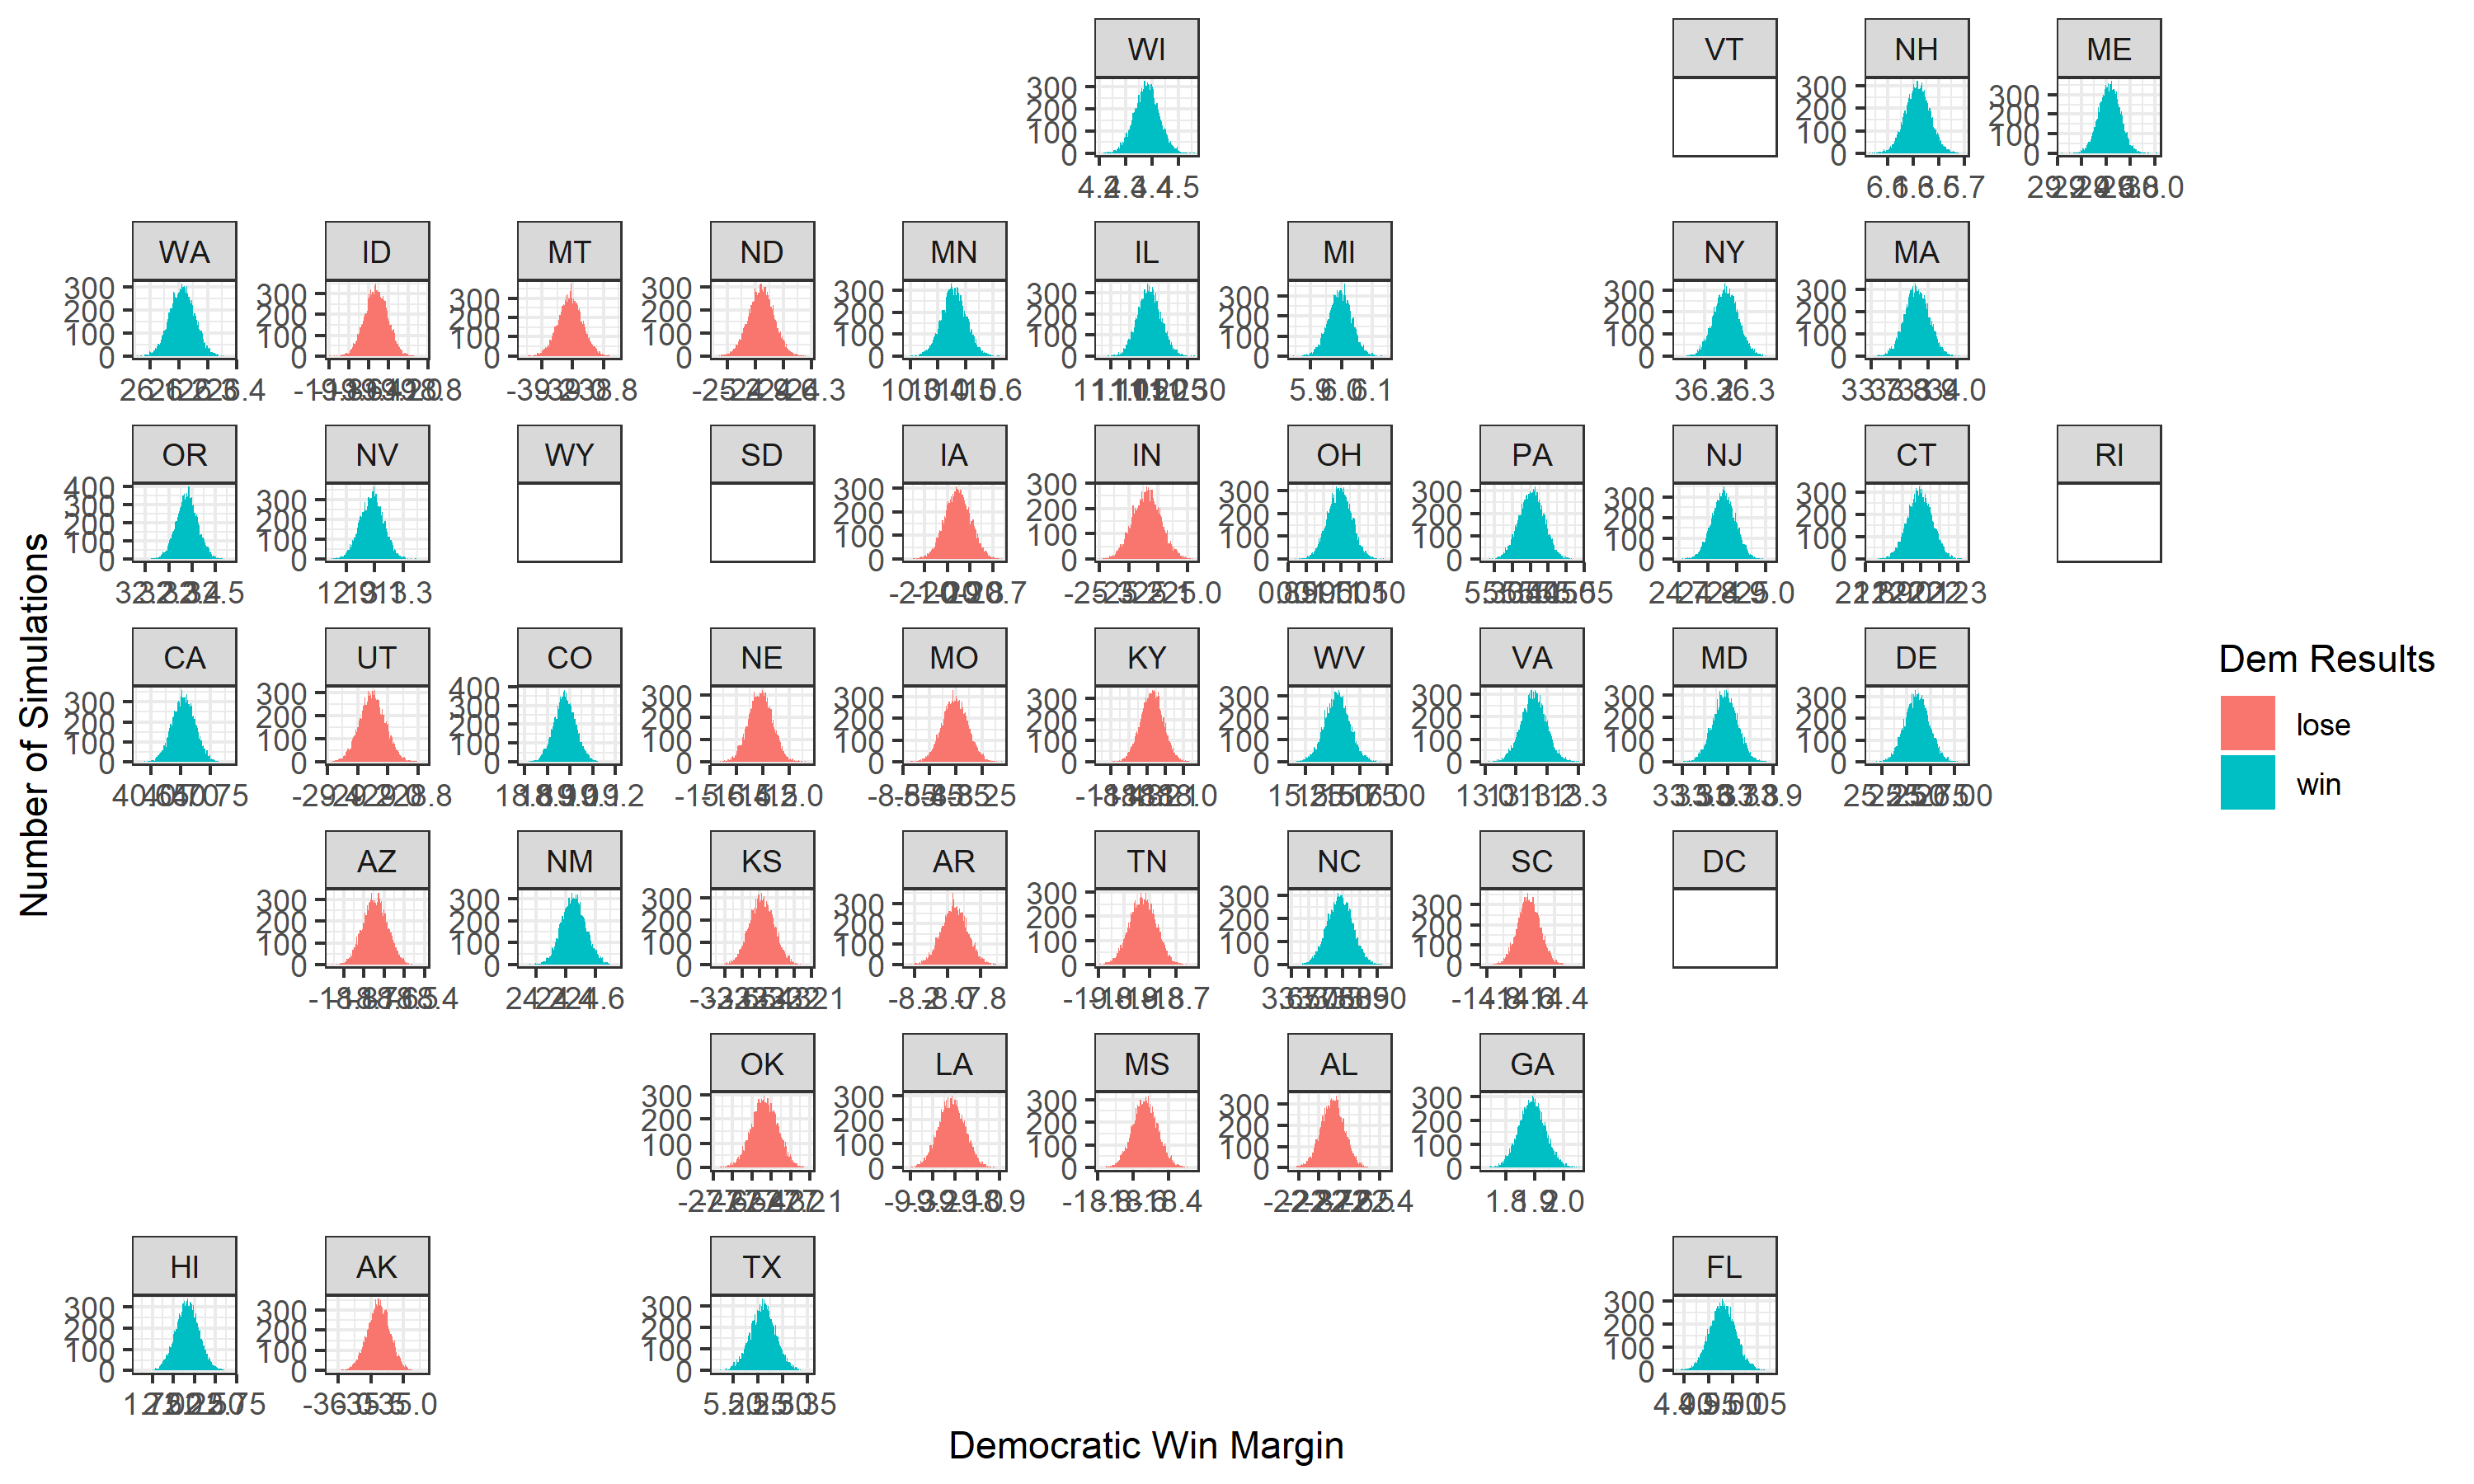
I used geofacet to create a map of the distributions, and colored each individual simulation by whether Biden won or lost that state. A damning result to this version of my model is that every state will always vote for one candidate. The spread does not allow for a state to swing between candidates, which is crucial for determining a probability accordant with reality. Nevertheless, I took the liberty of calculating the electoral votes for Biden in these 10000 scenarios (accounting for missing data) and found that he will win 396 electoral votes.